What Is Probability?
Taught in US schools
Key Takeaways
- Probability describes how likely an event is to happen, ranging from impossible to certain.
- The probability of an event can be expressed as a fraction: favorable outcomes divided by total possible outcomes.
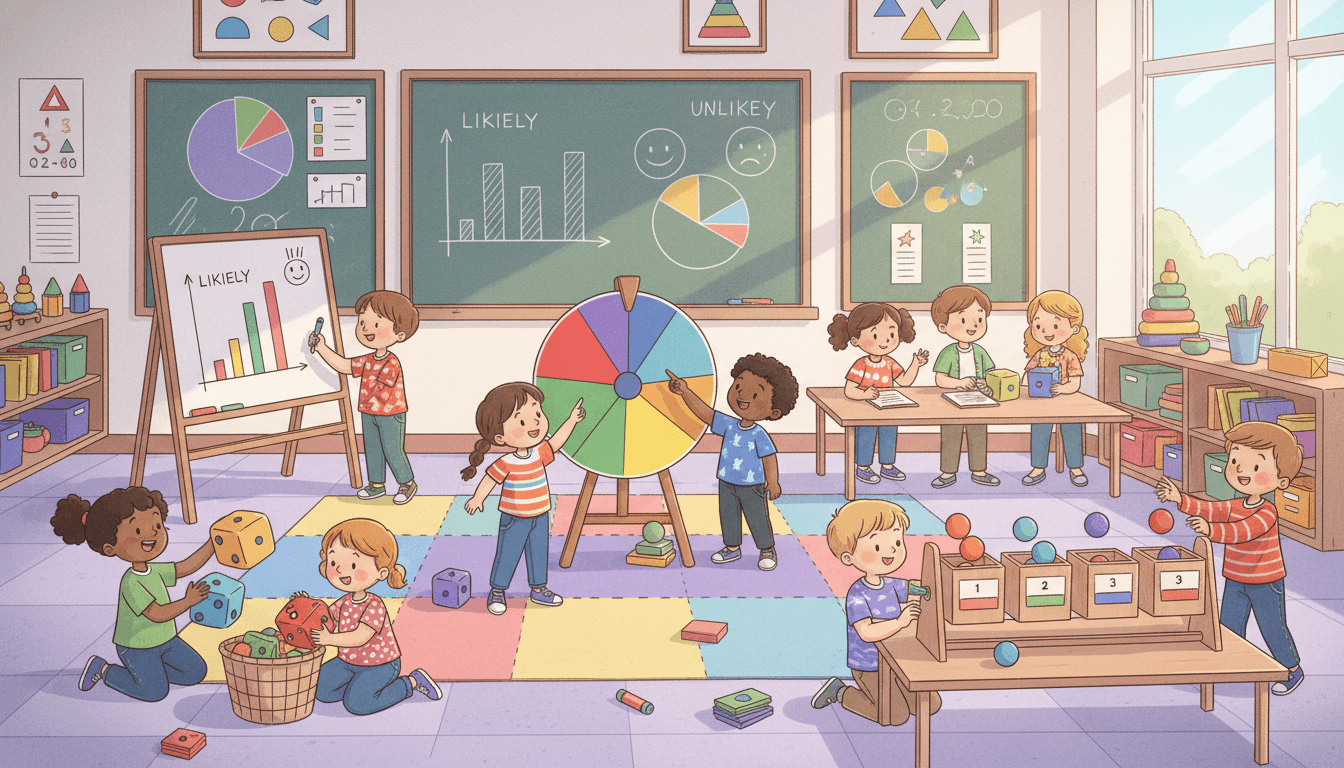
- Simple experiments - like flipping a coin, spinning a spinner, or rolling a number cube - help students explore probability in a hands-on way.
What Is Probability?
Probability is the measure of how likely it is that a particular event (outcome) will occur. Probability is used in everyday life - weather forecasts, games, sports predictions - and is a key math concept introduced in 3rd through 5th grade.
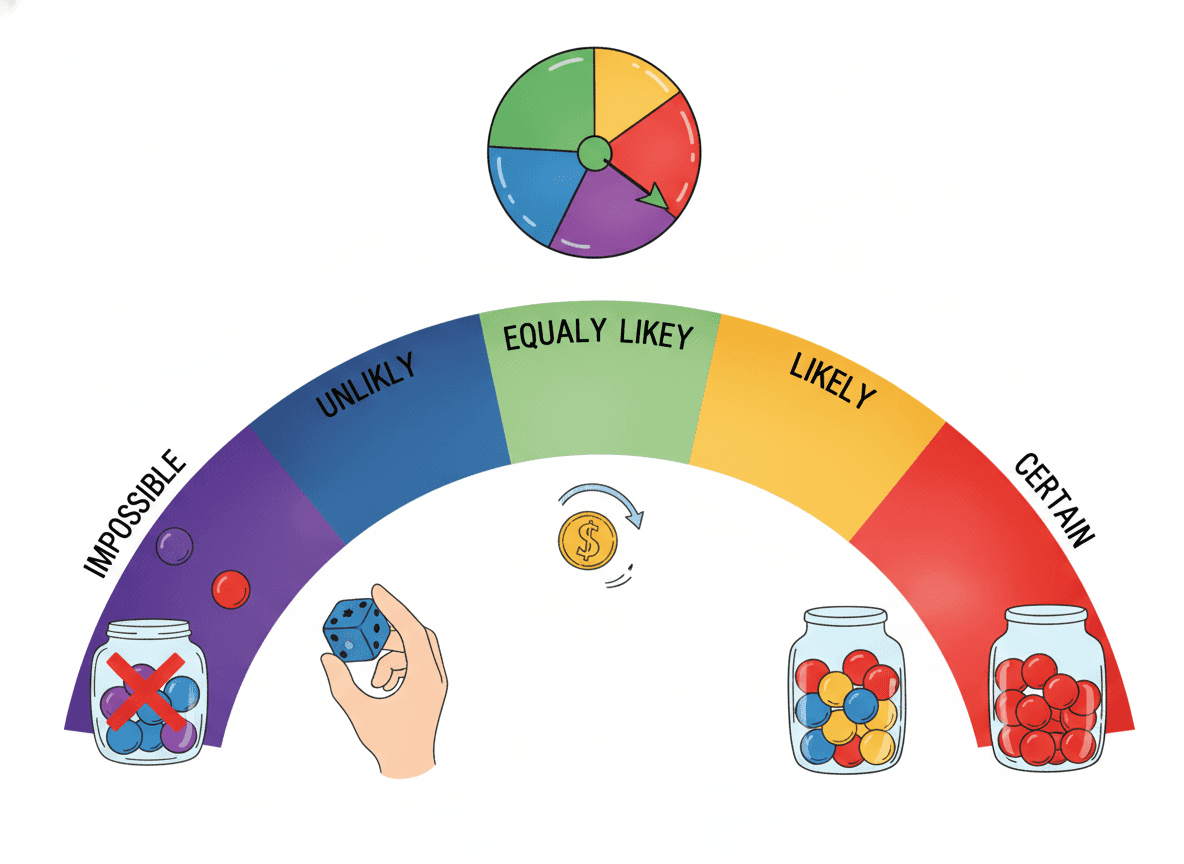
Probability Language: The Five Key Terms
Before writing probability as a number, students learn to describe likelihood using words:
Certain: Will always happen - Pulling a red marble from a bag containing only red marbles
Likely: Happens more often than not - Spinning a spinner that is mostly blue
Equally likely: Same chance of happening or not - Flipping a fair coin (heads or tails)
Unlikely: Happens less often than not - Rolling a 6 on a standard number cube
Impossible: Will never happen - Pulling a green marble from a bag with only red marbles
Writing Probability as a Fraction
Once students are comfortable with probability language, they learn to express probability as a fraction:
Probability = Favorable Outcomes ÷ Total Possible Outcomes
Example: A spinner has 4 equal sections: 2 red, 1 blue, 1 green.
- P(red) = 2/4 = 1/2 (likely)
- P(blue) = 1/4 (unlikely)
- P(yellow) = 0/4 = 0 (impossible)
Probability fractions are always between 0 and 1, inclusive:
-
0 means impossible
-
1 means certain
-
1/2 means equally likely
Simple Probability Experiments
Hands-on experiments make probability concrete:
Coin flip - 2 equally likely outcomes: heads or tails. P(heads) = 1/2.
Number cube (die) - 6 equally likely outcomes (1–6). P(rolling a 3) = 1/6. P(rolling an even number) = 3/6 = 1/2.
Spinner - outcomes depend on how the sections are divided. Students can design their own spinners to create specific probabilities.
Marble bag - students draw marbles, record results, replace, and draw again. After many trials, results approach the theoretical probability.
Theoretical vs. Experimental Probability
Theoretical: Predicted probability based on math - P(heads) = 1/2
Experimental: Actual results from running the experiment - Flipped 20 times; heads came up 9 times = 9/20 The more times an experiment is conducted, the closer the experimental probability gets to the theoretical probability. This is the Law of Large Numbers, explored informally in upper elementary.
Probability on a Number Line
Students often place probability values on a 0-to-1 number line to visualize likelihood. This connects probability to fractions and helps compare the likelihood of different events.
Practice Activities
- Have students design a spinner with 8 sections and color it so that P(blue) = 1/2, P(red) = 1/4, and P(yellow) = 1/4, then test it with 20 spins.
- Roll a number cube 30 times and record results in a tally chart; compare experimental results to the theoretical probability fractions.
- Provide a bag of colored cubes (hidden) and let students draw-replace-record to predict the contents; reveal the bag after 20 draws.
- Sort events onto a probability scale from impossible to certain (e.g., "It will snow in July," "The sun will rise tomorrow," "I will roll a 7 on a standard die").
- Give students a set of probability fractions and ask them to match each to a spinner design.
Frequently Asked Questions
What is the probability scale?
The probability scale goes from 0 (impossible - will never happen) to 1 (certain - will always happen). Events described as 'unlikely' have a probability closer to 0; 'likely' events are closer to 1; 'equally likely' events have a probability of 1/2 or 50%. Students begin with this language before moving to fractions.
How do you write probability as a fraction?
Probability as a fraction = number of favorable outcomes divided by total number of equally likely outcomes. If a bag has 3 red marbles and 5 blue marbles, the probability of picking red is 3/8 (3 favorable outcomes out of 8 total).
What is the difference between theoretical and experimental probability?
Theoretical probability is what you predict based on equal chances (e.g., flipping a fair coin: P(heads) = 1/2). Experimental probability is what actually happens when you run the experiment many times. The more trials you run, the closer experimental results tend to get to the theoretical probability.
Free Probability Worksheets
Curriculum-aligned printable worksheets for 3rd – 5th Grade. Download free.


