What Is Data and Graphing?
Taught in US schools
Key Takeaways
- Data is collected information. Graphs organize data visually for easier interpretation.
- Elementary students use tally marks, bar graphs, pictographs, and line plots.
- Reading a graph means interpreting what it shows - not just identifying bars or dots.
- Creating a graph means making decisions about scale, categories, and labels.
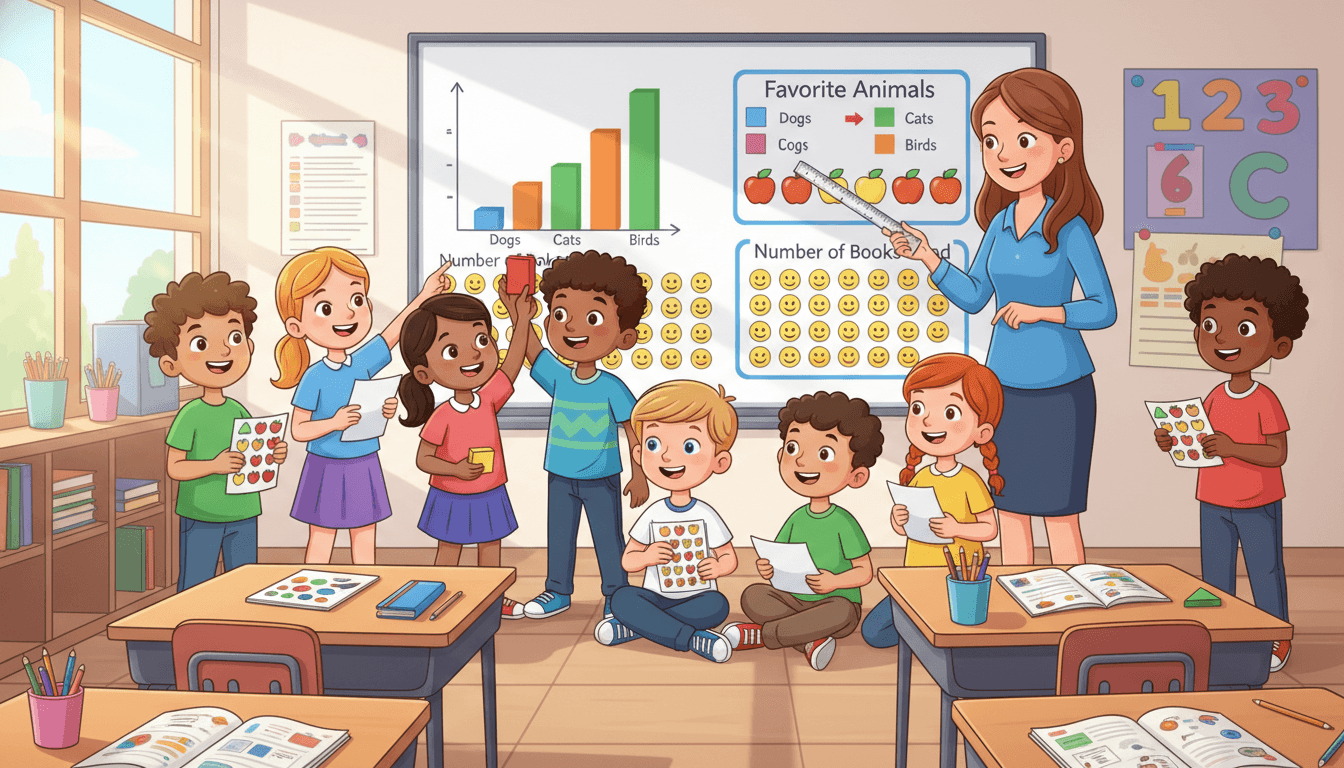
What Is Data and Graphing?
Data is collected information - numbers, categories, or measurements gathered to answer a question. Graphs are visual representations of data that make patterns, comparisons, and conclusions easier to see.
The data and graphing process has four stages:
- Collect: Gather information through counting, measuring, or surveying
- Organize: Sort data into categories or order it (tally marks, tables)
- Display: Create a visual representation (graph, chart)
- Interpret: Read the graph to answer questions and draw conclusions
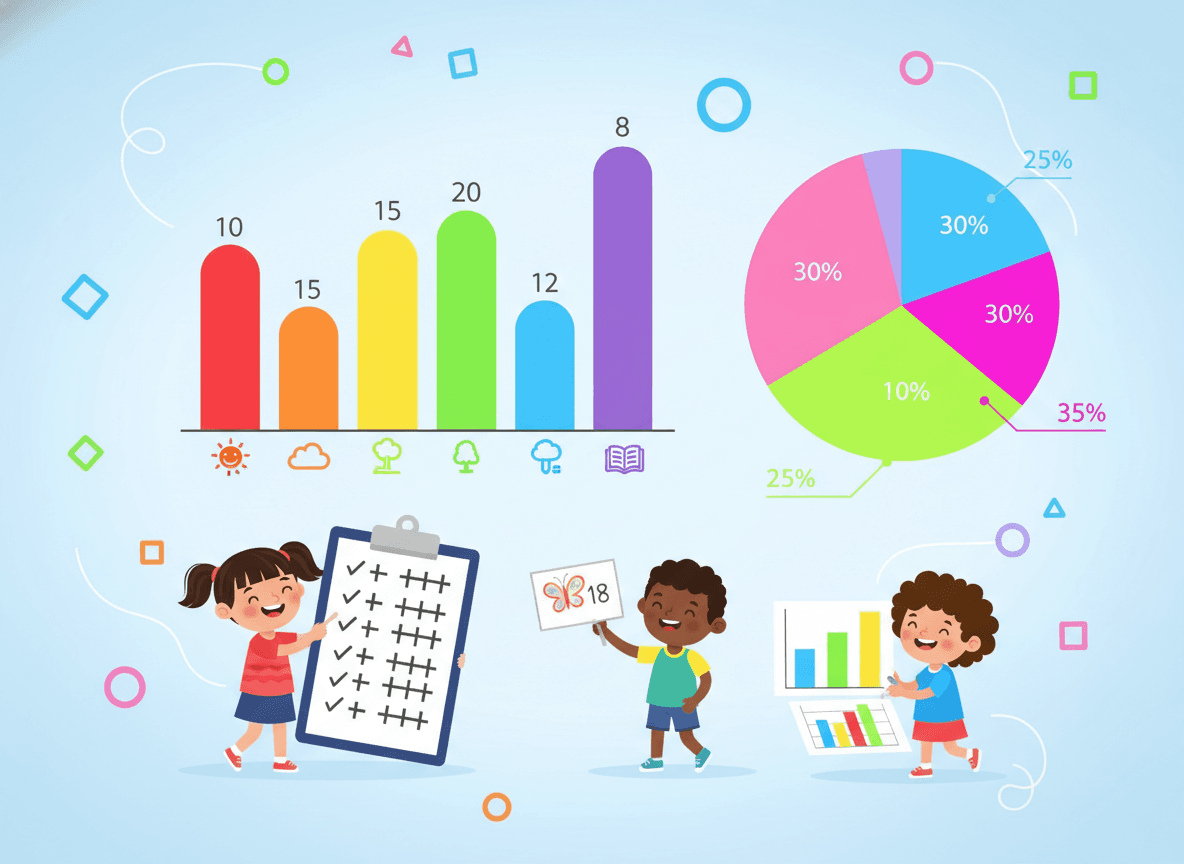
Types of Graphs in Elementary School
Picture graph/Pictograph: Uses pictures or symbols to represent data. Each symbol has a key showing its value (1 picture = 2 students). Best for simple categorical data with small counts.
Bar graph: Uses rectangular bars to show quantities. Height/length of bar = quantity. Easier to read precisely than pictographs. Scales on the axis can represent multiple units.
Tally chart: Uses tally marks to count. Not technically a graph but an organizing tool. Groups of 5 make counting easy.
Line plot: Places data points along a number line. Shows distribution and clustering. Used extensively in 3rd-5th grade with measurement data and fractions.
What Grade Do Kids Learn Data and Graphing?
Kindergarten: Sort and classify objects. Count in categories. Create simple object and picture graphs.
1st Grade: Organize data into three categories. Create and read picture graphs and bar graphs. Answer questions about total, most, fewest, and how many more.
2nd Grade: Picture graphs with scale (1 picture = multiple items). Bar graphs. Solve addition and subtraction problems using graph data.
3rd Grade: Scaled bar graphs (each bar represents multiple units). Solve multi-step problems using graph information.
4th Grade: Line plots with fractional data (½, ¼, ⅛ increments). Solve problems involving addition and subtraction of fractions using line plot data.
Common Misconceptions
"The tallest bar is the answer." Students sometimes point to the tallest bar when asked any question about a graph. Interpreting graphs requires reading the question carefully first.
"You don't need labels on a graph." A graph without a title, axis labels, and scale key is nearly unreadable. Requiring complete, labeled graphs from the start builds good habits.
"Each mark on a line plot represents the same value." Students sometimes mistake line plots for bar graphs. On a line plot, the position of the X matters - it represents a specific data value, not just a count.
Practice Activities
-
Class survey and graph: Survey classmates (favorite animal, pet, color). Tally results, create a bar graph, answer three interpretation questions.
-
Graph from data table: Give a table of data - students choose a graph type and create it.
-
Graph reading questions: Show a completed graph; students answer questions involving "how many more," "total," "difference."
-
Line plot measurement: Measure pencil lengths to nearest ½ inch; create a line plot; find the most common length.
-
Create your own questions: Students write 3 questions that can be answered from a given graph. Builds deep reading skills.
Frequently Asked Questions
What types of graphs do elementary students learn?
Kindergarten–1st: Sorting objects into categories, creating simple picture graphs and bar graphs. 2nd grade: Picture graphs with a scale (1 picture = 2 items), bar graphs. 3rd grade: Scaled bar graphs (intervals of 2, 5, 10), solving multi-step problems using graphs. 4th grade: Line plots showing measurement data in fractions of a unit.
What is a tally mark chart?
A tally chart uses marks to count items in categories. Each mark represents one item; the fifth mark crosses the previous four (making a bundle of 5). Tally marks are an easy entry point for data collection because kids can record in real time. They're typically introduced in 1st grade alongside bar graphs.
What is a line plot?
A line plot (dot plot) displays data along a number line, with X's or dots stacked above each value showing how many times it occurs. Example: measure the height of 15 plants to the nearest ¼ inch; plot each measurement. Line plots are the primary graph type in 3rd-5th grade Common Core data standards, often showing measurement data with fractions.
What does 'interpret data' mean?
Interpreting data means reading a graph or table and drawing conclusions from it - beyond just identifying which bar is tallest. 'The most popular flavor is chocolate.' 'There are 3 more students who prefer cats than dogs.' 'The total number of votes is 47.' These statements require reading, comparing, and sometimes computing with the data. Interpretation questions appear on every graph activity starting in 2nd grade.
What is the difference between a bar graph and a pictograph?
Both display categorical data visually. A pictograph uses pictures or symbols, where each symbol represents a specific quantity (a picture of an apple = 2 apples). A bar graph uses rectangles whose height or length shows the quantity. Bar graphs are generally easier to read and work with larger numbers; pictographs can be more engaging for younger students. Both require understanding a scale or key.
Free Data and Graphing Worksheets
Curriculum-aligned printable worksheets for Kindergarten – 4th Grade. Download free.


