
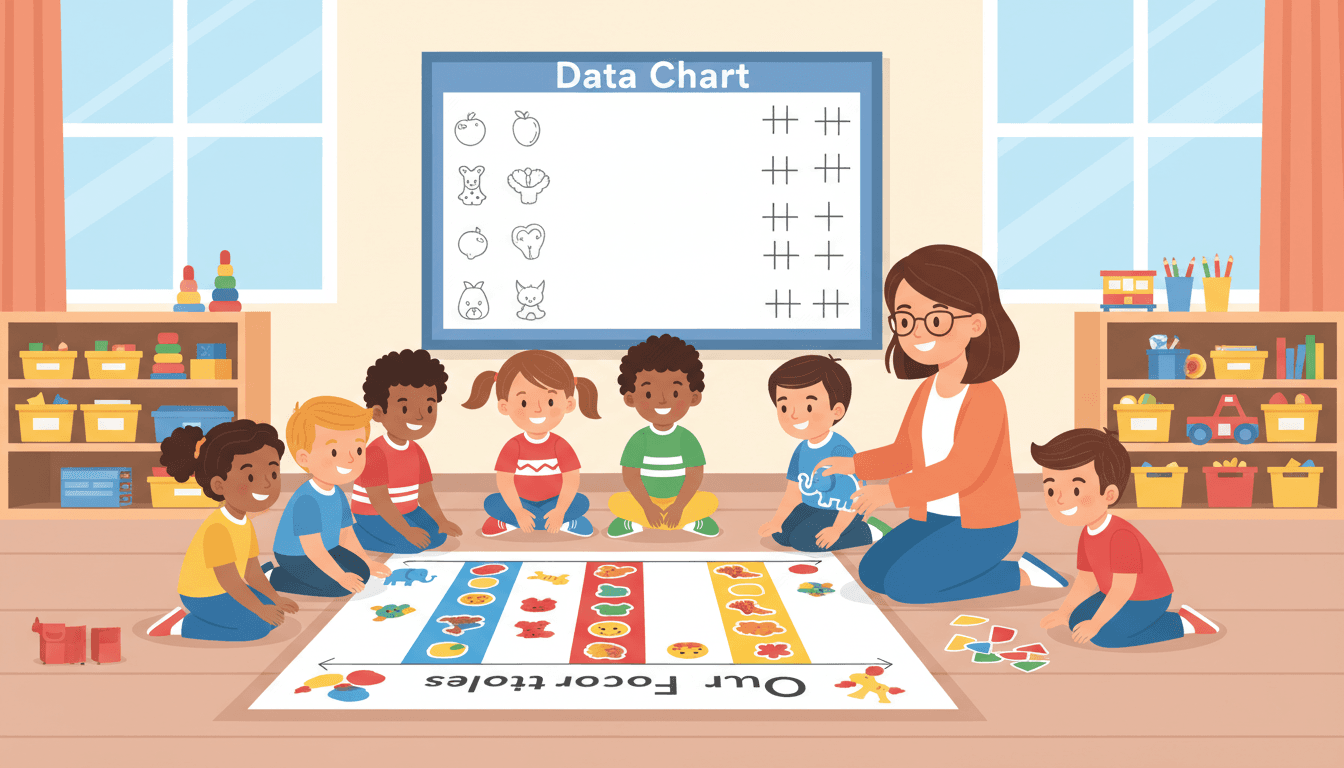
How to Teach Data and Graphing to Kindergartners
Key Takeaways
- Start with sorting activities before introducing graphs so kindergartners build the conceptual foundation that graphing is organized sorting.
- Human graphs using tape lines on the floor give students a concrete, physical experience with bar graphs before transitioning to paper versions.
- Use personal survey questions kids actually care about - favorite fruit, pets, how they got to school - to maximize engagement and make data feel meaningful.
- Picture graphs should come before bar graphs because they are more concrete, with one image per data point directly mirroring the human graph experience.
- Tally marks require extra modeling and repeated practice because the diagonal slash on every fifth mark confuses many kindergartners and rushing it causes lasting errors.
Here's one of the best things about teaching data and graphing in kindergarten: you can start the lesson by asking kids their favorite color, and suddenly every single one of them is paying attention.
Data is personal. And five-year-olds love talking about themselves, their opinions, and what they notice about the world. This topic is actually one of the easier sells in kindergarten math, once you frame it the right way.
Table of Contents
- Start With Sorting Before Graphing
- Collect Real Data From Real Questions
- Build a Human Graph First
- Introduce Picture Graphs
- Move to Bar Graphs
- Teach Tally Marks as a Counting Tool
- Learn to Ask Questions About Graphs
- Run a Classroom Survey
- Connect Data to Other Subjects
- FAQ
1. Start With Sorting Before Graphing
Graphing is organized sorting. Before your kiddos make a bar graph, they need to be comfortable sorting things into groups. Most kindergartners already have sorting experience from earlier math units. This is where you build the bridge.
"We're going to put things into groups. Then we're going to count each group. Then we're going to show the groups in a picture. That's what a graph is."
Not sure why exactly, but this activity tends to click faster than the ones that seem simpler.
Activities:
- Sort a pile of colored bears or blocks into color groups
- Sort a bag of small objects by shape, size, or color
- Sort themselves: "Everyone who walked to school today, stand on this side. Everyone who rode, stand on that side."
- Sort picture cards by category: animals vs. food, red vs. blue
- After sorting, ask: "Which group has more? Which has fewer? How do you know?"
That last question, "how do you know?", is important. You want students to start quantifying, not just visually comparing. Counting the groups is the beginning of data analysis.
Free Data Graphing Worksheets for Kindergarten


2. Collect Real Data From Real Questions
The moment data becomes about them, engagement goes up immediately.
Use survey questions that kindergartners actually care about:
- What is your favorite fruit: apple, banana, or strawberry?
- Do you have a pet at home: yes or no?
- What is your favorite color?
- How did you get to school today: walk, car, or bus?
- Do you prefer dogs or cats?
Activities:
- Ask the survey question during morning circle and record answers on a whiteboard
- Give each student a sticky note to place in the correct column on a chart
- Use a "vote" system: each child walks up and makes a mark under their choice
- Take a classroom poll using a show of hands and count together
- Let students suggest their own survey questions to investigate
The sticky-note vote is particularly powerful because every child's contribution is visible on the chart. They can see their data point. That makes it real.
3. Build a Human Graph First
Before any paper or pencil, make a graph with actual children. This is the most concrete and memorable version of the concept.
Put tape lines on the floor to create columns. Label each column. Have students stand in the column that matches their answer. Now you have a living bar graph.
"Look at our human graph. Which line is longest? That means more people chose that answer."
Activities:
- Do a "favorite season" human graph: four columns, students stand in their season
- "Do you like pineapple on pizza?" two columns: yes and no
- Walk down the lines and count each one together
- Ask: "How many more people chose ___ than ___?"
- Take a photo and post it on the classroom wall as your first "graph"
The human graph takes about 10 minutes and does more for conceptual understanding than 3 worksheets. It's that good.
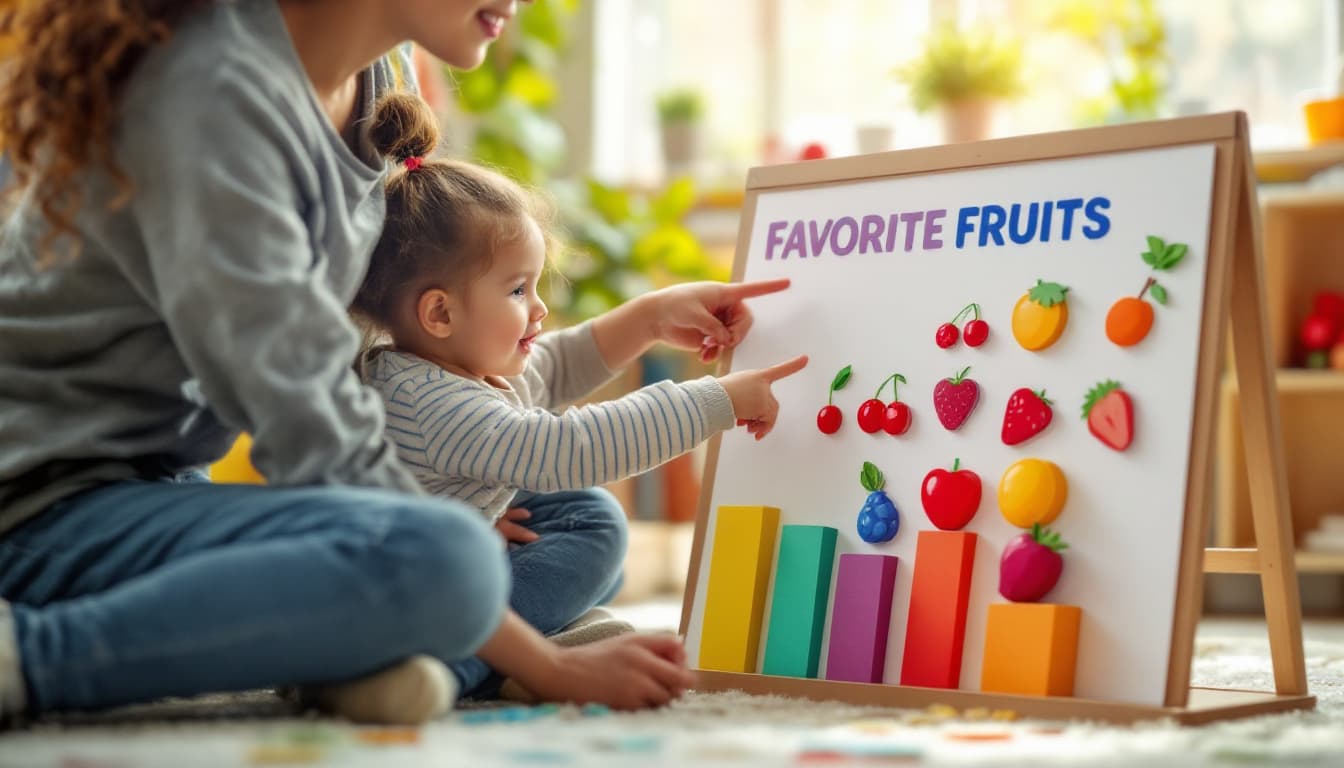
4. Introduce Picture Graphs
Once students understand the idea of sorting into columns and counting, picture graphs are a natural next step.
A picture graph uses images or symbols (a smiley face, a small drawing, a sticker) where each picture represents one person or one object. It looks like the human graph they already made, but on paper.
Activities:
- Take the human graph you just did and recreate it on paper using one small picture per student
- Give students pre-cut shapes to glue into columns on a graphing template
- Use stickers as data points: one sticker = one vote
- Draw a class pet vote picture graph together on the board
- Have students make their own picture graph of their family members (one shape per person)
Grab the kindergarten data and graphing worksheets for pre-formatted picture graph templates your kiddos can fill in right away.
Key vocabulary to introduce here:
- Title: what the graph is about
- Column: a up-and-down section of the graph
- Data: the information we collected
- Most: the column with the highest count
- Fewest: the column with the lowest count
5. Move to Bar Graphs
A bar graph is the same idea as a picture graph, but instead of individual pictures, you color in a bar to show the count. This is a slightly more abstract representation.
Introduce it by showing a picture graph and a bar graph of the exact same data side by side.
"Look. This graph uses pictures. This graph uses colored bars. They're showing the same thing."
Activities:
- Transition the class favorite-color data from a picture graph to a bar graph together
- Use grid paper: color one square per vote in each column
- Color code the bars to match what they represent (blue column for "blue is my favorite," etc.)
- Compare two graphs showing the same data: "Which is easier to read? Why?"
- Read pre-made bar graphs and answer questions about them
Answering questions about graphs is a critical skill. Practice these question types regularly:
- "Which has the most?" / "Which has the fewest?"
- "How many chose ___?"
- "How many more chose ___ than ___?"
- "How many people answered the survey altogether?"
6. Teach Tally Marks as a Counting Tool
Tally marks are how you record data as you collect it, one mark per item, with every fifth mark as a diagonal slash across the previous four. They're a tool for counting in groups of five.
This is often one of the trickier concepts for kindergartners because the diagonal "crossing" slash can feel confusing. Be patient and model it many times.
Activities:
- Make tally marks on the board while counting items together: add one mark at a time
- Do a "how many doors are in our school?" walk and make tally marks as you count
- Count tally marks together: "How many groups of five? How many left over?"
- Practice making tally marks for small numbers (1-10) before larger ones
- Connect tally marks back to the survey: "Let's record our votes using tally marks instead of sticky notes"
An honest admission here: tally marks are hard for some kindergartners to read back. The diagonal slash confuses the count. Practice counting pre-made tally mark sets repeatedly before asking students to make and read them independently. Rushing this one creates lasting confusion.
7. Learn to Ask Questions About Graphs
Collecting data is only half the skill. The other half is reading the data and drawing conclusions. This is where you teach students to be tiny data analysts.
After every graph, slow down and ask questions together. Don't accept "the red one is more" without "how do you know?"
Question types to practice:
- Identification: "What is this graph about?"
- Direct reading: "How many people chose chocolate?"
- Comparison: "Which got more votes, chocolate or vanilla?"
- Difference: "How many MORE chose chocolate than strawberry?"
- Total: "How many people answered this question altogether?"
Activities:
- Display a graph on the board and do a "graph talk" together before any worksheets
- Give students 3 questions to answer about a graph, then compare answers
- Have students write their OWN question about a graph (this is challenging and excellent for extending learners)
- Draw a graph and then write 2 sentences about it
- Create a "graph reading anchor chart" with sentence starters: "The most ___," "The fewest ___," "More people chose ___"
8. Run a Classroom Survey
A classroom survey is the full data cycle: asking a question, collecting information, organizing it, graphing it, and drawing conclusions. It's the big project that brings everything together.
How to run one:
- Choose a survey question as a class
- Each student surveys 5 classmates (using a clipboard and tally sheet)
- Bring data back to the group and combine it
- Create a class graph together
- Write 2-3 sentences about what the data shows
Survey question ideas:
- "What is your favorite season?"
- "Do you have a sibling?"
- "What is your favorite school subject?"
- "Would you rather have a superpower: flying or invisibility?"
- "What do you eat for breakfast most often?"
This activity can stretch over 2-3 days. Day 1: design the survey. Day 2: collect data. Day 3: graph and analyze. The multi-day structure builds investment.
9. Connect Data to Other Subjects
Data and graphing don't have to live only in math. You can bring them into science, reading, and social studies naturally.
In science:
- Graph the weather each day for a month (sunny, cloudy, rainy, snowy). Ask: which type of weather happened most?
- Sort and graph leaves collected outside by color or size
- Record plant growth in a chart and graph the results
In reading:
- After a read-aloud, graph students' favorite characters
- Graph the number of words on each page in a pattern book
- Survey: "Did you like this book? Thumbs up or thumbs down?"
In social studies:
- Graph how students get to school each day
- Graph birthday months and look for patterns
- Graph pets owned by the class
Cross-subject connections reinforce the idea that data is a life skill, not a math worksheet. Our kiddos start to see it everywhere.
FAQ
Is graphing too advanced for kindergarten? Not at all, as long as you start concretely. Human graphs, sticky-note charts, and picture graphs are well within kindergarten reach. The key is moving from concrete (actual objects or people) to representational (pictures) to abstract (bar graphs) slowly.
My students can make a graph but can't answer questions about it. What helps? This is a separate skill that needs direct teaching. Practice "graph talk" as a whole group before asking students to work independently. Model how to look at a graph and say what you notice. Use sentence starters posted on the wall.
How do tally marks fit with kindergarten counting skills? Tally marks reinforce grouping by fives and connect to skip counting, both of which are kindergarten math standards. Introduce them after students are comfortable with counting to 20 and grouping objects by fives.
What materials do I need to teach data and graphing? Sticky notes, colored bears or blocks, a clipboard per student, basic graphing templates, crayons, and access to the kindergarten data and graphing worksheets. Real objects and student surveys do more than any specialty material.
Keep Reading
- How to Teach Comparing Numbers to Kindergartners
- How to Teach Measurement to Kindergartners
- How to Teach Money to Kindergartners
Conclusion
Data and graphing in kindergarten is really about teaching kids to look at the world with curious, organized eyes. "I wonder how many." "Let's find out." "What does that tell us?"
Those three moves, wondering, collecting, and making sense of information, are habits of mind that go far beyond math.
Start with human graphs. Let your kiddos be the data. Then move to sticky notes, picture graphs, and bar graphs at whatever pace feels right for your group. For printable practice that covers the full progression, the kindergarten data and graphing worksheets at ClassWeekly are ready when you are.
Your little data scientists are going to love this unit. 📊

Adi Ackerman
Head Teacher
Adi is the Head Teacher at ClassWeekly, with years of experience teaching elementary students. She designs our curriculum-aligned worksheets and writes practical guides for teachers and parents.
Keep Reading
Ready to download? Try ClassWeekly free for 30 days.
Unlimited worksheets for PreK through 5th grade. Cancel anytime.