What Are Mean, Median, and Mode?
Taught in US schools

Key Takeaways
- Mean is the average - sum of all values divided by the count of values.
- Median is the middle value when data is arranged in order; resistant to extreme values.
- Mode is the value that appears most often in a data set; there can be more than one mode.
- All three measures describe the 'center' of a data set but can give different answers for the same data.
What Are Mean, Median, and Mode?
Mean, median, and mode are three ways to describe the center or typical value of a data set. Together they are called measures of central tendency.
Understanding these measures helps students summarize data, make comparisons, and draw conclusions - foundational data literacy skills introduced in upper elementary and formalized in middle school statistics.
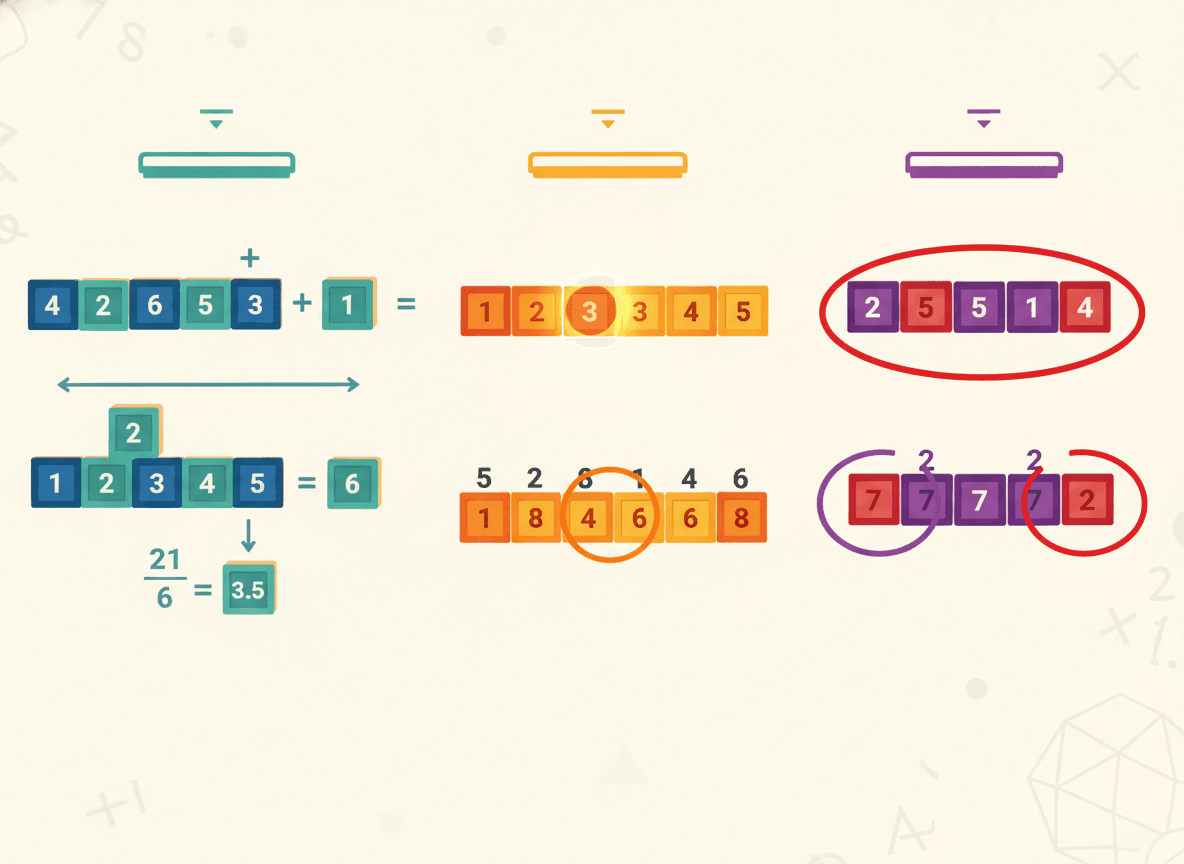
Mean (Average)
Formula: Sum of all values ÷ Number of values
Data set: 6, 8, 3, 9, 4 Sum: 6 + 8 + 3 + 9 + 4 = 30 Mean: 30 ÷ 5 = 6
The mean is the most commonly used measure in everyday life. It balances all values like a seesaw - values above the mean are balanced by values below it.
Median (Middle Value)
Steps: Arrange in order → Find the middle
Ordered: 3, 4, 6, 8, 9 → Middle value = 6
For even numbers of values, take the mean of the two middle values: 2, 5, 7, 10 → middle values are 5 and 7 → Median = (5 + 7) ÷ 2 = 6
The median is resistant to outliers. If the 9 above were 90 instead, the median would still be 6, but the mean would jump to 21.
Mode (Most Frequent)
Data set: 4, 7, 4, 9, 4, 7, 3 → Mode = 4 (appears 3 times)
Multiple modes: 2, 5, 5, 8, 8, 10 → Modes = 5 and 8 (bimodal) No mode: 1, 2, 3, 4, 5 → All appear once.
What Grade Do Kids Learn This?
5th grade intro: Some curricula introduce mean and mode in 5th grade as part of data analysis.
6th grade (CCSS formal introduction 6.SP.A.2, 6.SP.B.5): Mean, median, mode, and range are formally taught as measures of center and variability. The concepts are often previewed in 5th grade.
Common Misconceptions
Mean and average are different things: They are the same. "Average" is the everyday term; "mean" is the mathematical term.
The median is always a number in the data set: For even-numbered data sets, the median is the mean of two middle values and may not appear in the original data.
Mode is the biggest number: Students sometimes confuse mode with maximum. Mode is about frequency, not size.
Practice Activities
-
Data from class: Collect data (shoe sizes, number of siblings) and calculate all three measures.
-
Outlier exploration: Find mean and median of a small set, then add an extreme outlier and recalculate - compare the effect.
-
Card draw: Shuffle number cards, draw 7, order them, find mean, median, and mode.
-
Match the measure: Give three data sets and three measures - students match each data set to the measure that best describes it.
-
Create and compare: Students design a data set where the mean, median, and mode are all different and explain why.
Frequently Asked Questions
What is the mean?
The mean (also called the average) is found by adding all values in a data set and dividing by the number of values. For example, the mean of 4, 7, 9, 10, 5 is (4+7+9+10+5) ÷ 5 = 35 ÷ 5 = 7. The mean balances the data set like a fulcrum on a number line.
What is the median?
The median is the middle value when all data points are arranged in order from least to greatest. For an odd number of values, it is the exact middle. For an even number of values, it is the mean of the two middle values. The median is not affected by extremely high or low values (outliers), making it useful for skewed data sets.
What is the mode?
The mode is the value that appears most frequently in a data set. A data set can have one mode, multiple modes, or no mode (if all values appear equally). Mode is especially useful for categorical data (like favorite colors) where mean and median don't apply.
Which measure of central tendency should I use?
It depends on the data. Mean works well for data without extreme outliers. Median is better for data with outliers (like home prices or incomes, where a few very high values skew the mean). Mode is most useful for categorical data or for finding the most popular value. Often, reporting all three together gives the fullest picture.
What is range and how does it relate to these measures?
Range is not a measure of center - it measures spread. Range = maximum value - minimum value. It describes how spread out the data is. Range is taught alongside mean, median, and mode as part of data analysis: while the three M's describe the center, range describes the variability.
Free Mean, Median, and Mode Worksheets
Curriculum-aligned printable worksheets for 5th Grade. Download free.
Common Core Standards


