What Is a Pictograph?
Taught in US schools
Key Takeaways
- A pictograph uses pictures or symbols to represent data, with each picture standing for a set number.
- The key (or legend) tells you what each picture represents.
- Pictographs are an early graphing type - visual and accessible for young learners.
- Reading a pictograph requires multiplication when each symbol represents more than 1.
What Is a Pictograph?
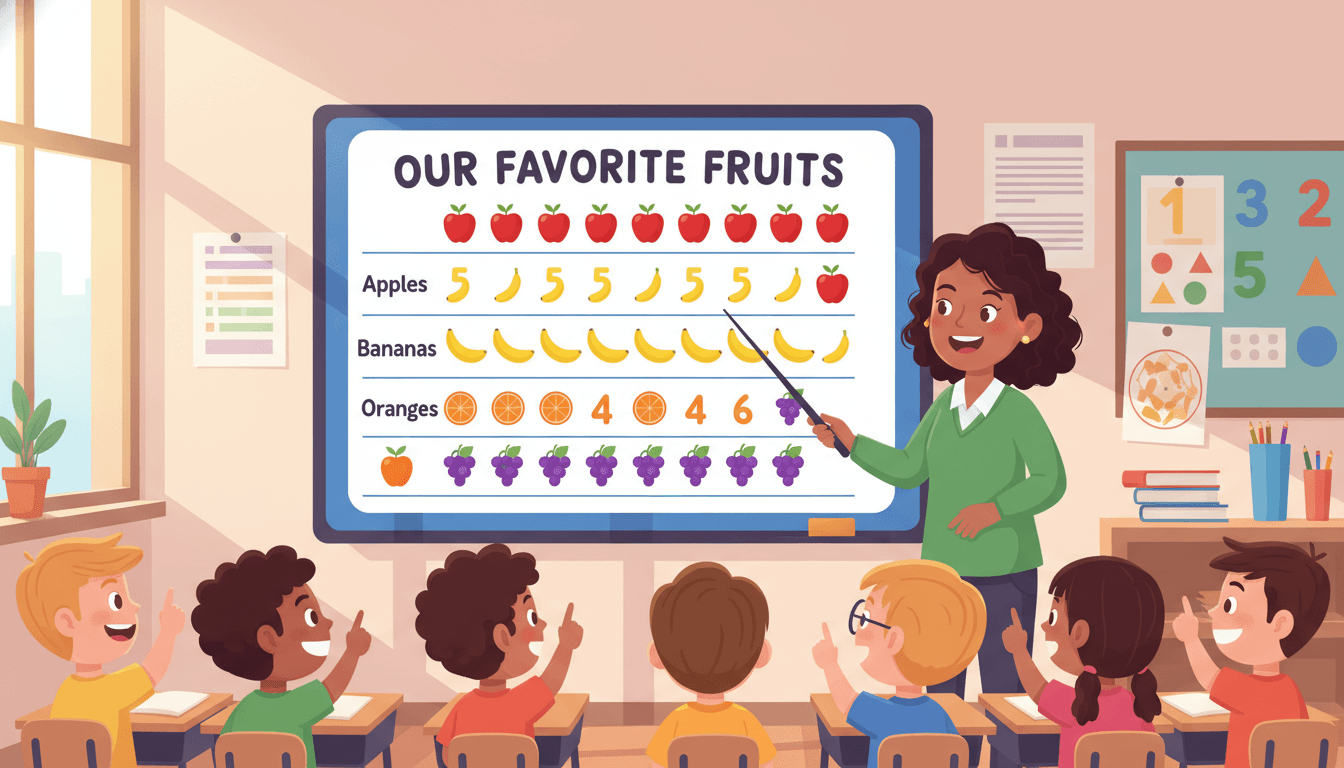
A pictograph is a type of graph that uses pictures or symbols to represent data. Each picture stands for a specific number of items, which is shown in the key (also called the legend).
Pictographs are one of the first graphing types introduced in elementary school because they are visual, concrete, and accessible to young learners - even those still developing reading skills can interpret pictures.
Parts of a Pictograph
Title - What data is being shown?
Categories - Listed vertically on the left (e.g., types of pets, favorite foods, sports played)
Symbols / Pictures - Drawn in rows next to each category; more symbols = more of that item
Key / Legend - Tells what each symbol represents
Example: 🍎 = 2 students
How to Read a Pictograph
- Read the title to understand what the graph is about
- Read the key to know what each symbol stands for
- Count the symbols in each row
- Multiply: symbols × key value = total
Example:
Favorite Season Survey Key: each sun ☀️ = 5 students Summer: ☀️ ☀️ ☀️ = 15 students Winter: ☀️ ☀️ = 10 students Fall: ☀️ ☀️ ☀️ ☀️ = 20 students Spring: ☀️ = 5 students
Questions students answer: Which season is most popular? How many more students chose fall than winter? How many students were surveyed in all?
Half Symbols
In grade 2-3 pictographs, students encounter half symbols - when a value falls between two whole symbols, a half-picture is used.
Key: each star ⭐ = 4 students 2.5 stars = 10 students (2 × 4 = 8, plus half of 4 = 2, total = 10)
This builds fractional thinking and careful reading.
Creating a Pictograph
- Collect data (class survey, experiment results, etc.)
- Choose a symbol that relates to the topic
- Choose a key value (what will each symbol represent?)
- Draw the symbols in rows
- Label categories, add a title, and include the key
Practice Activities
- Class survey: ask students their favorite color, season, or food. Tally responses, then have students create a pictograph of the results.
- Give students a completed pictograph and ask comparison questions: "How many more? How many fewer? How many in all?"
- Provide raw data and a blank pictograph template; students determine the key value, draw symbols, and label everything.
- Compare the same data shown in a pictograph and a bar graph: "What is easier to read in each? Which do you prefer?"
Frequently Asked Questions
What is a pictograph?
A pictograph is a type of graph that uses pictures or symbols to display data. Each symbol represents a fixed number of items, shown in the key or legend. For example, a pictograph about favorite fruits might use a picture of a strawberry to represent 2 students. If there are 4 strawberry symbols next to 'strawberry,' that means 8 students chose strawberry as their favorite fruit.
What is the key or legend on a pictograph?
The key (or legend) on a pictograph tells you what each symbol or picture represents numerically. For example: 'Each apple = 5 students.' Without the key, you cannot interpret the pictograph. Reading and using the key is a critical skill when working with pictographs - students must multiply the number of symbols by the value each symbol represents.
How is a pictograph different from a bar graph?
Both pictographs and bar graphs display categorical data and allow for comparison. A pictograph uses pictures or symbols; a bar graph uses bars of different heights. Pictographs are more visual and often more engaging for young students, but they can be harder to read precisely when values don't divide evenly. Bar graphs are more precise and easier to read for exact values.
Free Pictograph Worksheets
Curriculum-aligned printable worksheets for Kindergarten – 3rd Grade. Download free.


