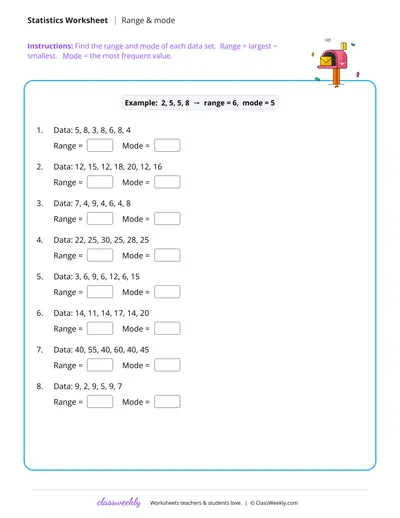
Range, median & mode

Free printable range, median & mode worksheet for 5th grade students. Part of our range, median & mode data & graphing collection. Aligned to Common Core standards.
How do I use this worksheet?
Before handing out the worksheet, briefly introduce the concept with a short oral warm-up or a visual model on the board. Encourage students to talk through their thinking as they work: "What strategy are you using? How do you know that is right?" After completing the worksheet, review any missed problems together and discuss the reasoning rather than just the answer. For extra support, let students use manipulatives or draw pictures alongside the written problems. These range, median & mode worksheets work well as daily practice, homework, or a focused review activity.
What students will practice
- Students will recognize and apply range, median & mode concepts using grade-appropriate strategies and models.
- Students will solve problems involving range, median & mode with increasing accuracy and confidence.
- Students will connect range, median & mode skills to real-world situations and explain their reasoning clearly.


Curriculum Links
Common Core State Standards
Math · 5th Grade
Find this in the curriculum
Browse the grade, subject, and topic this belongs to.
FAQ
How do I use this range, median & mode worksheet?⌄
Before handing out the worksheet, briefly introduce the concept with a short oral warm-up or a visual model on the board. Encourage students to talk through their thinking as they work: "What strategy are you using? How do you know that is right?" After completing the worksheet, review any missed problems together and discuss the reasoning rather than just the answer. For extra support, let students use manipulatives or draw pictures alongside the written problems. These range, median & mode worksheets work well as daily practice, homework, or a focused review activity.
What does this worksheet teach?⌄
These range, median & mode worksheets for 5th grade give students the structured, hands-on practice they need to build confidence and fluency. Students work through a range of problem formats, from visual models and diagrams to written equations and word problems, so they encounter range, median & mode from every angle. Each worksheet is designed to build on prior knowledge while introducing the level of challenge appropriate for 5th grade. Practicing range, median & mode at this stage strengthens the mathematical foundations that support more advanced concepts in later grades.
What grade level is this for?⌄
This worksheet is designed for 5th Grade students (Ages 10-11), aligned to Common Core standard 6.SP.B.5. It can also be used as review for early students at the next grade level or as an introduction for advanced students.
Can I use this for homeschool or classroom?⌄
Yes. This worksheet works for homeschool, classroom, and tutoring settings. Print individual pages for targeted practice, or print the full set as a packet. Works great as a morning warm-up, independent center activity, or fast-finisher task.
What data and graphing skills do fifth graders develop?⌄
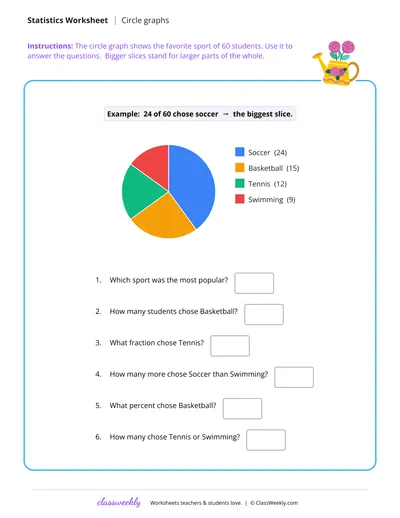
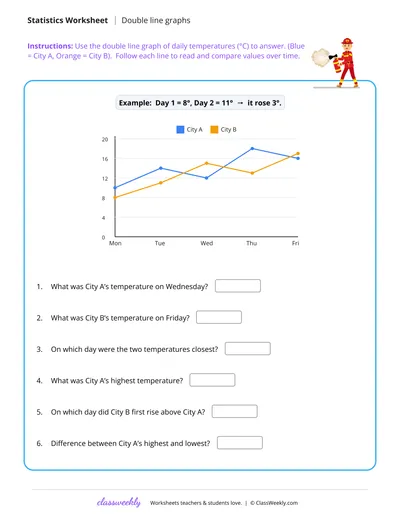
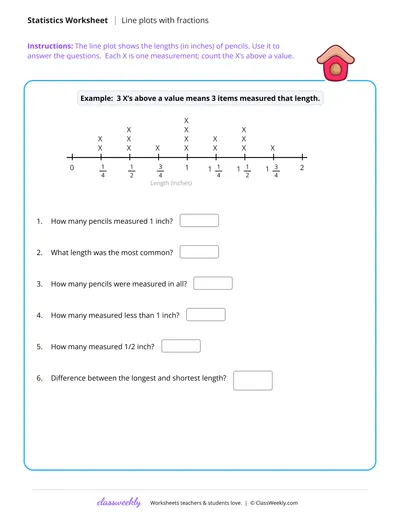
Fifth-grade data and statistics focuses on representing and interpreting data in more complex graphical forms and computing basic statistical measures (CCSS 5.MD.B.2). Students create and interpret line plots that include fractional data values (a line plot showing plant heights measured to the nearest 1/8 inch), and they solve problems involving operations on the data in the plot. They also work with double bar graphs and double line graphs (comparing two data sets), stem-and-leaf plots, and circle graphs. Measures of center (mean, median, mode) and spread (range) are introduced or deepened at this level. A key data skill is choosing the right graph type for a given data set: bar graphs for categories, line graphs for change over time, stem-and-leaf plots for examining distribution. Worksheets that include both graph construction and interpretation (reading a graph to answer questions) develop the full competency. Interpretation tasks should include questions that require going beyond reading individual data points to drawing comparisons or making inferences.
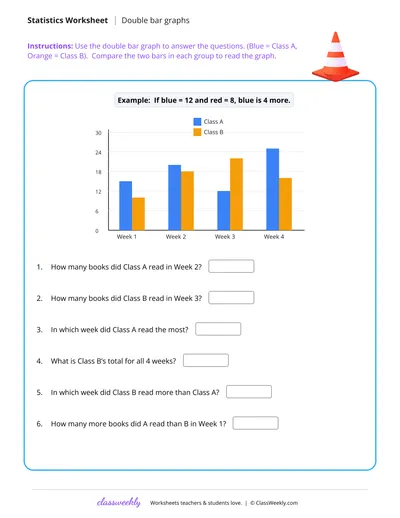
How do fifth graders read and create double bar graphs?⌄
A double bar graph shows two data sets side by side for the same categories, using bars of different colors or patterns to distinguish them. Reading a double bar graph requires using the legend, identifying which bar corresponds to which data set, and reading bar heights precisely to the nearest labeled unit or interpolating between gridlines. Creating a double bar graph requires choosing a consistent scale, drawing bars of uniform width, spacing pairs of bars evenly, and including a complete legend. Common errors include using different scales for the two data sets (making one appear much larger), unlabeled axes, and a missing legend that makes the two data sets indistinguishable. Worksheets that give students partially completed double bar graphs (one data set drawn, one to complete) reduce setup time while still building the skills needed for full construction. Interpretation questions that compare the two data sets (which month showed the largest difference between sales? in which category were the values most similar?) develop analytical reading skills beyond simple data retrieval.
What is a stem-and-leaf plot and when do fifth graders learn it?⌄
A stem-and-leaf plot organizes numerical data by splitting each value into a stem (the leading digits) and a leaf (the trailing digit). For data in the range 40-80, the tens digits become stems (4, 5, 6, 7, 8) and the ones digits become leaves. The plot shows all individual data values while revealing the overall distribution shape, making it useful for identifying clusters, gaps, and outliers. Fifth graders create stem-and-leaf plots from raw data sets and answer questions about them, including identifying the median (the middle value once the leaves are ordered), mode (the most common leaf for a given stem), and range. A back-to-back stem-and-leaf plot shows two data sets using the same stems, with leaves branching in opposite directions; this format is useful for comparing two groups (boys vs. girls, before vs. after). Worksheets should require students to order the leaves in ascending order within each stem, since an unordered stem-and-leaf plot is a common construction error that makes finding median and mode unreliable.
Ratings & Reviews
55 reviews
Reviews are for ClassWeekly members.
Sarah K.
Kindergarten Teacher · Verified member
Used these with my class. The clear format worked perfectly for students still building confidence. I print a new set every week.
Rachel H.
Homeschool parent · Verified member
I print these every Sunday for the week ahead. My kids never complain about worksheet time when it's ClassWeekly.
Beth C.
Homeschool parent · Verified member
These have become part of our daily routine. Quick to print, easy to explain, and my daughter feels accomplished when she finishes.
Lisa M.
Pre-K Teacher · Verified member
Perfect for my little learners. Simple, focused, and no distracting clutter. These are in my weekly rotation.
Priya N.
Kindergarten Teacher · Verified member
I love how these are designed for actual classroom use. Margins are good for little hands, font is readable, and activities are just the right length.
Make a Request
Spotted something to fix, or want a worksheet we don't have yet? Tell us and we'll make it.
Worksheet Details
| Grade | 5th Grade |
| Subject | Math |
| Topic | Data & Graphing |
| Standard | 6.SP.B.5 |
| Pages | 1 page |
| Difficulty | Medium |
What is ClassWeekly?
ClassWeekly offers free worksheets and printable learning resources for kids in preschool to grade 5. All worksheets are aligned to Common Core standards and designed by educators. Become a member to access the full library and download unlimited PDFs.