Creating Pie Charts
Written by Adi Ackerman, Head Teacher
"Creating Pie Charts" is written for 2nd Grade (Ages 7-8), and it covers Common Core 2.MD.D.10. If your little one is a year younger but already steady on data & graphing, the page still works. You may just need to read the instructions out loud. And if they are older and creating pie charts never quite stuck, this is a short review rather than busywork.

Free printable creating pie charts worksheet for 2nd grade students. Part of our creating pie charts data & graphing collection. Aligned to Common Core standards.
How do I use this worksheet?
Before handing out the worksheet, briefly introduce the concept with a short oral warm-up or a visual model on the board. Let students work through it independently after a quick group example, checking in with a partner if they get stuck, encouraging them to talk through their thinking: "What strategy are you using? How do you know that is right?" After completing the worksheet, review any missed problems together and discuss the reasoning rather than just the answer. For extra support, let students use manipulatives or draw pictures alongside the written problems. These creating pie charts worksheets work well as daily practice, homework, or a focused review activity.
What students will practice
- Students will recognize and apply creating pie charts concepts using number lines and place-value models.
- Students will solve problems involving creating pie charts with increasing accuracy and confidence.
- Students will connect creating pie charts skills to real-world situations and explain their reasoning clearly.


Curriculum Links
Common Core State Standards
Measurement and Data · 2nd Grade
Standard: Draw a picture graph and a bar graph (with single-unit scale) to represent a data set with up to four categories.
View all 2.MD.D.10 worksheets →Find this in the curriculum
Browse the grade, subject, and topic this belongs to.
FAQ
How do I use this creating pie charts worksheet?
⌄
Before handing out the worksheet, briefly introduce the concept with a short oral warm-up or a visual model on the board. Let students work through it independently after a quick group example, checking in with a partner if they get stuck, encouraging them to talk through their thinking: "What strategy are you using? How do you know that is right?" After completing the worksheet, review any missed problems together and discuss the reasoning rather than just the answer. For extra support, let students use manipulatives or draw pictures alongside the written problems. These creating pie charts worksheets work well as daily practice, homework, or a focused review activity.
What does this worksheet teach?
⌄
These creating pie charts worksheets for 2nd grade give students the structured, hands-on practice they need to build confidence and fluency. Students work through a range of problem formats, from visual models and diagrams to written equations and word problems, so they encounter creating pie charts from every angle. Each worksheet is designed to build on prior knowledge while introducing the level of challenge appropriate for 2nd grade. Practicing creating pie charts at this stage strengthens the mathematical foundations that support more advanced concepts in later grades.
Can I use this creating pie charts worksheet for homeschool or classroom?
⌄
Yes, both. We made it for 2nd Grade data & graphing, and the page works the same whether it lands on a kitchen table or a center rotation. At home, most families go through it together and talk the answers out loud, and that talking is where most of the learning happens with creating pie charts. In class it runs well as independent work while you pull a small group. Print one copy or thirty, whichever the day needs.
How do pie charts reinforce fraction concepts at the 2nd grade level?
⌄
Each section of a pie chart represents a fraction of the whole data set - shading half a circle for 50% of a data category makes fractions visual and concrete.
Are pie charts a formal 2nd grade standard?
⌄
Pie charts extend beyond core CCSS 2nd grade standards but are commonly included as enrichment since they deepen data literacy and fraction intuition.
What data types work best for 2nd grade pie charts?
⌄
Simple surveys with 2-4 categories work best - for example, favorite colors or types of pets - keeping the sections visually distinct and countable.
What is a tally chart?
⌄
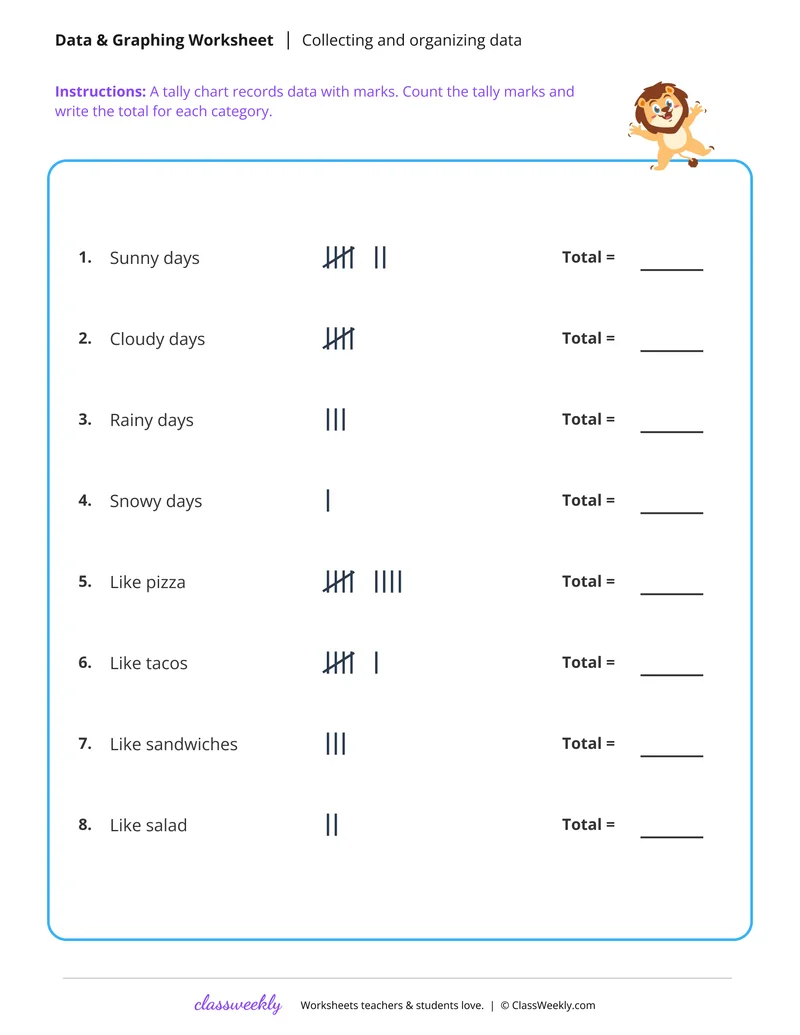
A tally chart counts with marks. Each mark is one vote, and a bundle of 5 has four marks and one line across. Children count the marks to answer questions like which lunch got the most votes.
How do 2nd graders make a data table?
⌄
They count each kind of thing in a picture, such as bugs in a garden or shoes on a shelf, and write each count in its row. Then they use the table to find a total or answer questions.
Which standards cover data and graphing in 2nd grade?
⌄
2.MD.D.10 asks children to draw and read picture graphs and bar graphs with up to four groups. 2.MD.D.9 asks them to measure lengths and show them on a line plot.
Do the data worksheets have answer keys?
⌄
Most sheets come with an answer key. The tally chart and data table pages also open with a worked example.
Ratings & Reviews
No reviews yet. Be the first to share what you think.
Reviews are for ClassWeekly members.
Make a Request
Spotted something to fix, or want a worksheet we don't have yet? Tell us and we'll make it.
Worksheet Details
| Grade | 2nd Grade |
| Subject | Math |
| Topic | Data & Graphing |
| Standard | 2.MD.D.10 |
| Pages | 1 page |
| Difficulty | Medium |
Learn More
What is ClassWeekly?
ClassWeekly offers free worksheets and printable learning resources for kids, from preschool up. All worksheets are aligned to Common Core, NGSS, and C3 Framework standards and designed by educators. Become a member to access the full library and download unlimited PDFs.