Tally Spinner Results Then Graph
Written by Adi Ackerman, Head Teacher
"Tally Spinner Results Then Graph" is written for 2nd Grade (Ages 7-8), and it covers Common Core 2.MD.D.10. If your little one is a year younger but already steady on data & graphing, the page still works. You may just need to read the instructions out loud. And if they are older and graphing tally counts never quite stuck, this is a short review rather than busywork.
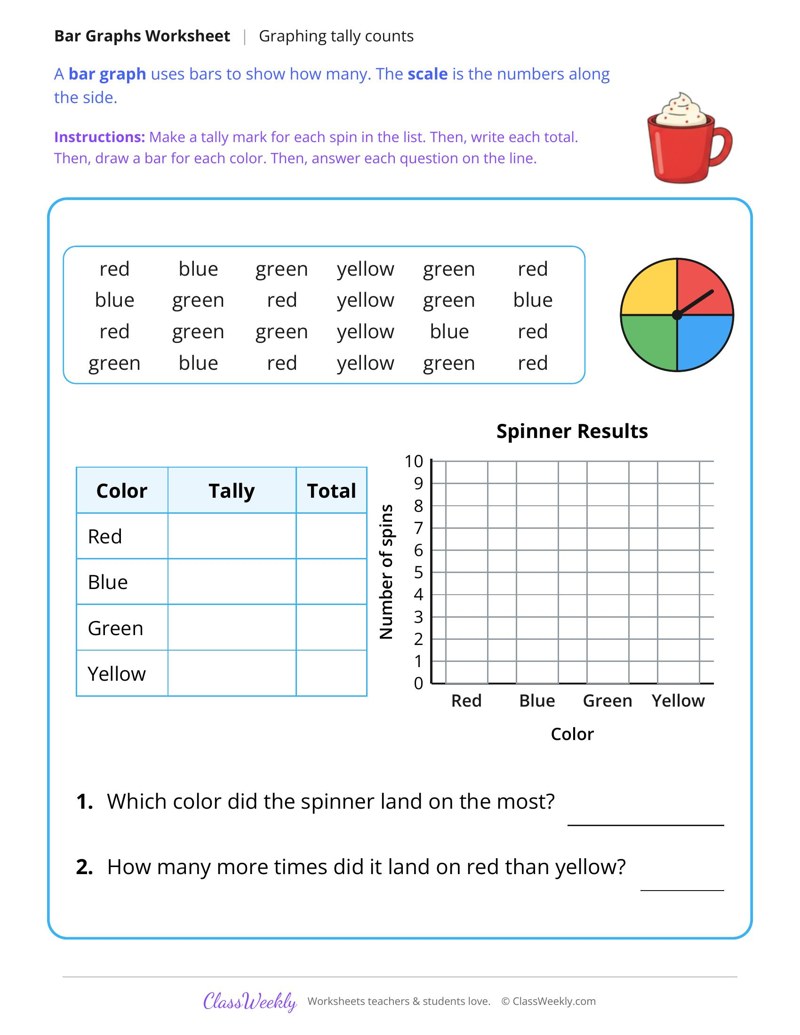
2nd grade math worksheet: tally 24 spinner results for red, blue, green and yellow, draw a bar graph and answer 2 questions. Answer key included. Part of our graphing tally counts collection. Aligned to Common Core standards.
How do I use this worksheet?
Before handing out the worksheet, briefly introduce the concept with a short oral warm-up or a visual model on the board. Let students work through it independently after a quick group example, checking in with a partner if they get stuck, encouraging them to talk through their thinking: "What strategy are you using? How do you know that is right?" After completing the worksheet, review any missed problems together and discuss the reasoning rather than just the answer. For extra support, let students use manipulatives or draw pictures alongside the written problems. These graphing tally counts worksheets work well as daily practice, homework, or a focused review activity.
What students will practice
- Students will make a tally mark for each of 24 spinner results.
- Students will write each color's total and draw a bar graph of the spins.
- Students will find the color landed on most and compare red with yellow.


Curriculum Links
Common Core State Standards
Measurement and Data · 2nd Grade
Standard: Draw a picture graph and a bar graph (with single-unit scale) to represent a data set with up to four categories.
View all 2.MD.D.10 worksheets →Find this in the curriculum
Browse the grade, subject, and topic this belongs to.
FAQ
How do I use this graphing tally counts worksheet?
⌄
Before handing out the worksheet, briefly introduce the concept with a short oral warm-up or a visual model on the board. Let students work through it independently after a quick group example, checking in with a partner if they get stuck, encouraging them to talk through their thinking: "What strategy are you using? How do you know that is right?" After completing the worksheet, review any missed problems together and discuss the reasoning rather than just the answer. For extra support, let students use manipulatives or draw pictures alongside the written problems. These graphing tally counts worksheets work well as daily practice, homework, or a focused review activity.
What does this worksheet teach?
⌄
Tally 24 spinner results for red, blue, green and yellow, draw a bar graph and answer 2 questions. A bar graph uses bars to show how many. The scale is the numbers along the side. The directions on the page read: Make a tally mark for each spin in the list. Then, write each total. Then, draw a bar for each color. Then, answer each question on the line. An answer key is included.
Can I use this graphing tally counts worksheet for homeschool or classroom?
⌄
Yes, both. We made it for 2nd Grade data & graphing, and the page works the same whether it lands on a kitchen table or a center rotation. At home, most families go through it together and talk the answers out loud, and that talking is where most of the learning happens with graphing tally counts. In class it runs well as independent work while you pull a small group. Print one copy or thirty, whichever the day needs.
How do you turn a tally chart into a bar graph?
⌄
Count each row of tally marks by fives and then ones, and write the total. Then draw a bar for that group up to the total on the scale. Doing one group at a time keeps any row from being skipped.
Why do tally marks come in bundles of five?
⌄
The fifth mark crosses the first four, so each bundle is 5. Counting by fives and then by ones is faster than counting every line, and it is easy to check.
What does the spinner page practice?
⌄
Children read a list of 24 spins, make a tally mark for each one, write each color's total and draw the bar graph. It walks through the whole path from collecting data to graphing it.
What data and graphing skills do 2nd graders learn?
⌄
CCSS 2.MD.D.10 asks 2nd graders to draw a picture graph and a bar graph with a single-unit scale for data in up to four groups, and to solve put together, take apart and compare problems from the graph. CCSS 2.MD.D.9 adds measuring objects to the nearest whole unit and showing the lengths on a line plot.
What is the difference between a picture graph and a bar graph?
⌄
A picture graph shows each thing as a picture, and its key tells what one picture stands for. A bar graph shows each group as a bar that reaches a number on the scale. In 2nd grade each picture or grid line stands for 1.
What kinds of questions do the graph worksheets ask?
⌄
How many are in one group, how many more or fewer one group has than another, how many are in two groups together, how many in all, and what happens when some are added or taken away, such as 4 trucks driving out of a parking lot.
Do these worksheets have answer keys?
⌄
Yes. All 37 2nd grade data and graphing sheets have an answer key.
Ratings & Reviews
No reviews yet. Be the first to share what you think.
Reviews are for ClassWeekly members.
Make a Request
Spotted something to fix, or want a worksheet we don't have yet? Tell us and we'll make it.
Worksheet Details
| Grade | 2nd Grade |
| Subject | Math |
| Topic | Data & Graphing |
| Standard | 2.MD.D.10 |
| Pages | 1 page |
| Difficulty | Medium |
Learn More
What is ClassWeekly?
ClassWeekly offers free worksheets and printable learning resources for kids in preschool to grade 5. All worksheets are aligned to Common Core, NGSS, and C3 Framework standards and designed by educators. Become a member to access the full library and download unlimited PDFs.