Veterans Day Count and Graph
Written by Adi Ackerman, Head Teacher
"Veterans Day Count and Graph" is written for Kindergarten (Ages 5-6), and it covers Common Core K.MD.B.3. If your little one is a year younger but already steady on data and graphing, the page still works. You may just need to read the instructions out loud. And if they are older and bar graphs never quite stuck, this is a short review rather than busywork.
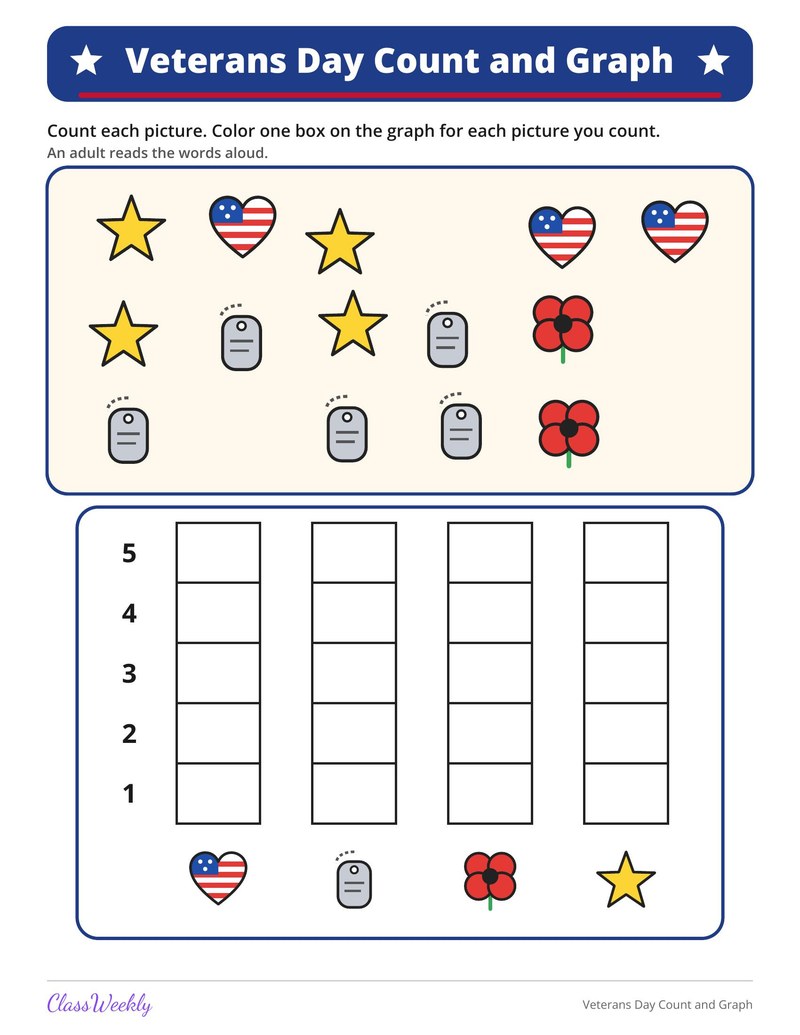
Kindergarten math worksheet: count flag hearts, dog tags, poppies and stars, then color one box on the bar graph for each picture. Answer key included. Part of our bar graphs data and graphing collection. Aligned to Common Core standards.
More Veterans Day activitiesVeterans Day 2026: dates and teaching guide
How do I use this worksheet?
Print the page and read the directions with your child: Count each picture. Color one box on the graph for each picture you count. An adult reads the words aloud. When they finish, check the work together with the answer key.
What students will practice
- Students will count up to 5 objects in each of four groups.
- Students will color one box on a bar graph for each object counted.
- Students will compare which picture has more or fewer on the graph.


Curriculum Links
Common Core State Standards
Measurement and Data · Kindergarten
Standard: Classify objects into given categories; count the numbers of objects in each category and sort the categories by count.
View all K.MD.B.3 worksheets →Find this in the curriculum
Browse the grade, subject, and topic this belongs to.
FAQ
How do I use this bar graphs worksheet?
⌄
Print the page and read the directions with your child: Count each picture. Color one box on the graph for each picture you count. An adult reads the words aloud. When they finish, check the work together with the answer key.
What does this worksheet teach?
⌄
A picture box of Veterans Day pictures to count: flag hearts, dog tags, poppies and stars, with up to five of each. Below it is a bar graph numbered 1 to 5 with a column for each picture, where children color one box for each picture they count. The directions on the page read: Count each picture. Color one box on the graph for each picture you count. An adult reads the words aloud. An answer key is included.
Can I use this bar graphs worksheet for homeschool or classroom?
⌄
Yes, both. We made it for Kindergarten data and graphing, and the page works the same whether it lands on a kitchen table or a center rotation. At home, most families go through it together and talk the answers out loud, and that talking is where most of the learning happens with bar graphs. In class it runs well as independent work while you pull a small group. Print one copy or thirty, whichever the day needs.
What skills do bar graph worksheets build in kindergartners?
⌄
Bar graph worksheets build number sense, comparison skills, and the ability to read visual representations of data. Children practice counting, identifying larger and smaller quantities, and connecting numbers to a graphical format.
When are kindergartners ready to work with bar graphs?
⌄
Children are typically ready for simple bar graphs once they can count reliably to 10 and compare quantities. Most kindergartners encounter bar graphs in the second half of the school year after building strong counting and sorting foundations.
How can I help my child practice bar graphs at home?
⌄
Try making a simple bar graph together using stickers or drawings-graph favorite fruits or the number of each type of toy. Then use the printed worksheets to reinforce reading pre-made graphs and answering questions about them.
What data and graphing activities are appropriate for kindergarten?
⌄
Kindergarteners should classify objects into categories, count the objects in each category, and sort the counts (CCSS K.MD.B.3). They typically create and interpret picture graphs and real object graphs using classroom items (sorting bears by color, graphing favorite snacks). The focus is on counting and comparing categories, not abstract graph construction.
How do you introduce graphing to kindergarteners?
⌄
Start with concrete graphs: line up real objects by category and compare the rows visually. Progress to pictorial graphs where students place a sticky note or draw a mark for each item. Introduce comparison vocabulary: more, fewer, the most, the fewest, the same. Worksheets with simple picture graphs and yes/no or count questions are appropriate for reinforcing graph-reading skills.
What vocabulary should kindergarteners know for data activities?
⌄
Key vocabulary includes: sort, classify, category, same/different, more/fewer/equal, most/least, total, how many. These terms appear in CCSS K.MD.B.3 graph interpretation questions and carry forward into first-grade data work. Consistently using this vocabulary during sorting and graphing activities, including on worksheets, ensures students learn the mathematical language alongside the concepts.
What is on these kindergarten data and graphing worksheets?
⌄
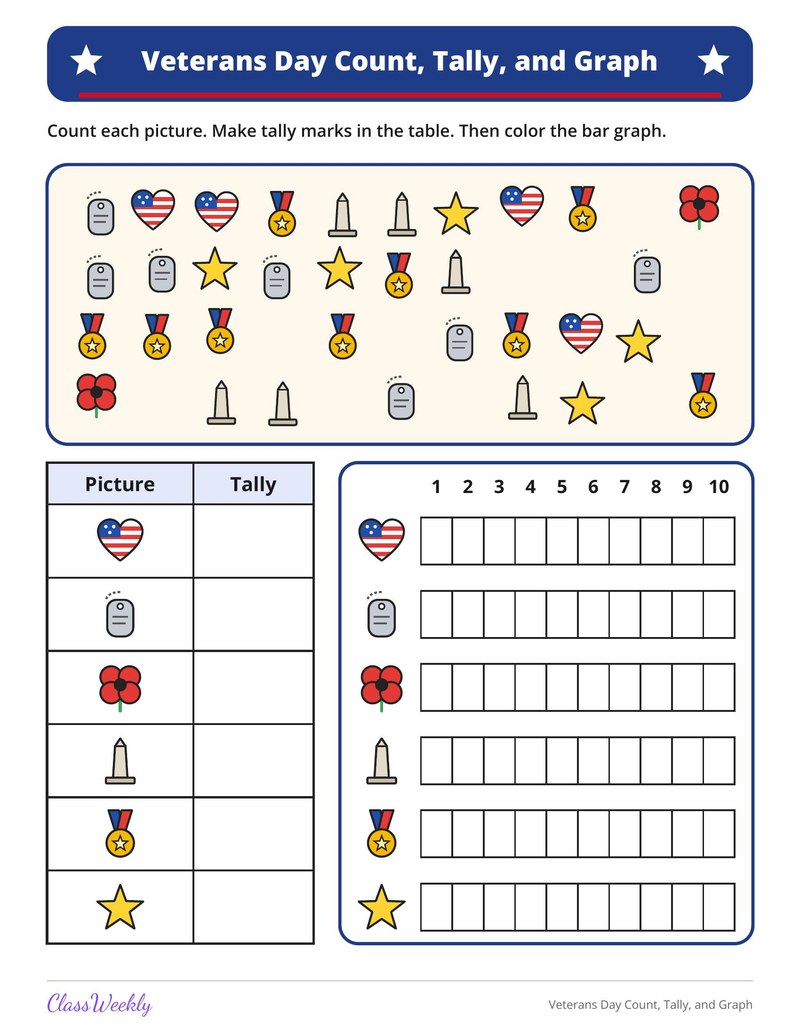
Ten sort and count pages, such as farm animals, a fruit bowl and socks sorted by pattern, ask children to count each kind, write the number and circle the group with the most or the fewest. Other pages count and draw tally marks to 10, color a bar graph of balloons, read a bar graph of pets and add pictures to find how many in all.
Ratings & Reviews
No reviews yet. Be the first to share what you think.
Reviews are for ClassWeekly members.
Make a Request
Spotted something to fix, or want a worksheet we don't have yet? Tell us and we'll make it.
Worksheet Details
| Grade | Kindergarten |
| Subject | Math |
| Topic | Data and graphing |
| Standard | K.MD.B.3 |
| Pages | 1 page |
| Difficulty | Medium |
What is ClassWeekly?
ClassWeekly offers free worksheets and printable learning resources for kids in preschool to grade 5. All worksheets are aligned to Common Core, NGSS, and C3 Framework standards and designed by educators. Become a member to access the full library and download unlimited PDFs.