Graph Proportional Relationships From Tables
Written by Adi Ackerman, Head Teacher
"Graph Proportional Relationships From Tables" is written for 8th Grade (Ages 13-14), and it covers Common Core 8.EE.B.5. A 7th grader who is already steady on linear equations can use it too, and an older student can use it as a short review.
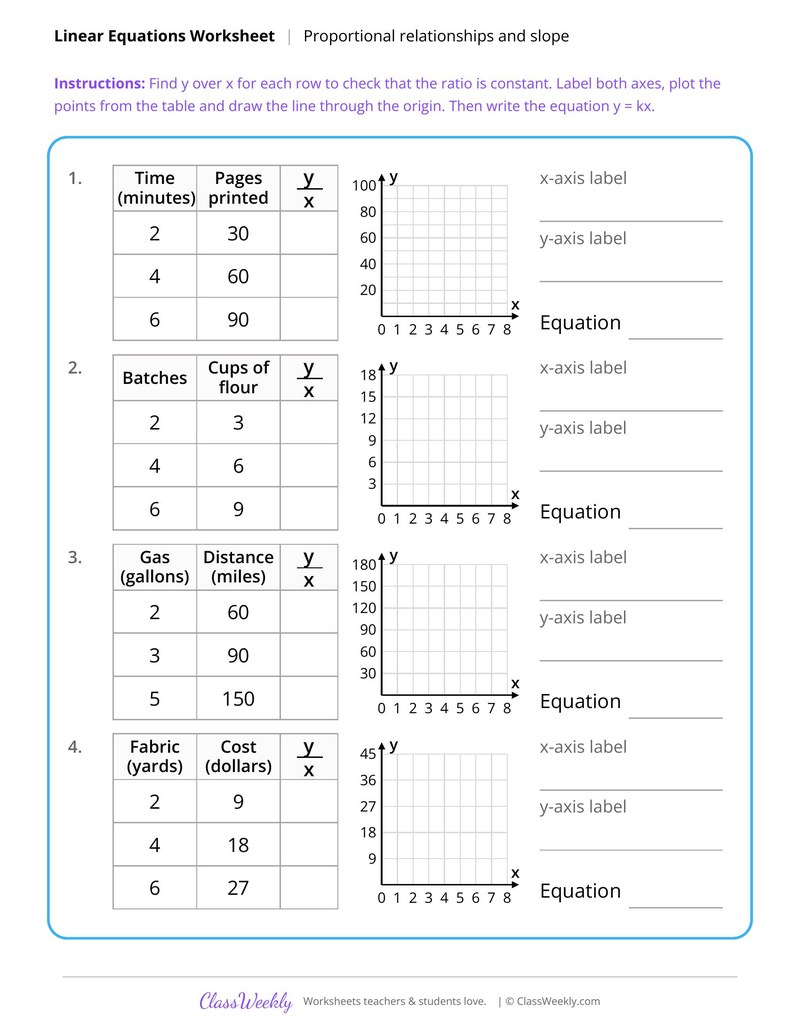
8th grade math worksheet: check that y over x is constant in tables for pages printed and cups of flour, then graph and write y = kx. Answer key included. Part of our proportional relationships and slope linear equations collection. Aligned to Common Core standards.
How do I use this worksheet?
Begin with the two reading sheets so students connect slope and unit rate. Then move to graphing and finish with the comparison sheet.
What students will practice
- Students will divide y by x to check that a ratio is constant.
- Students will label axes and graph points through the origin.
- Students will write the equation y = kx for each table.
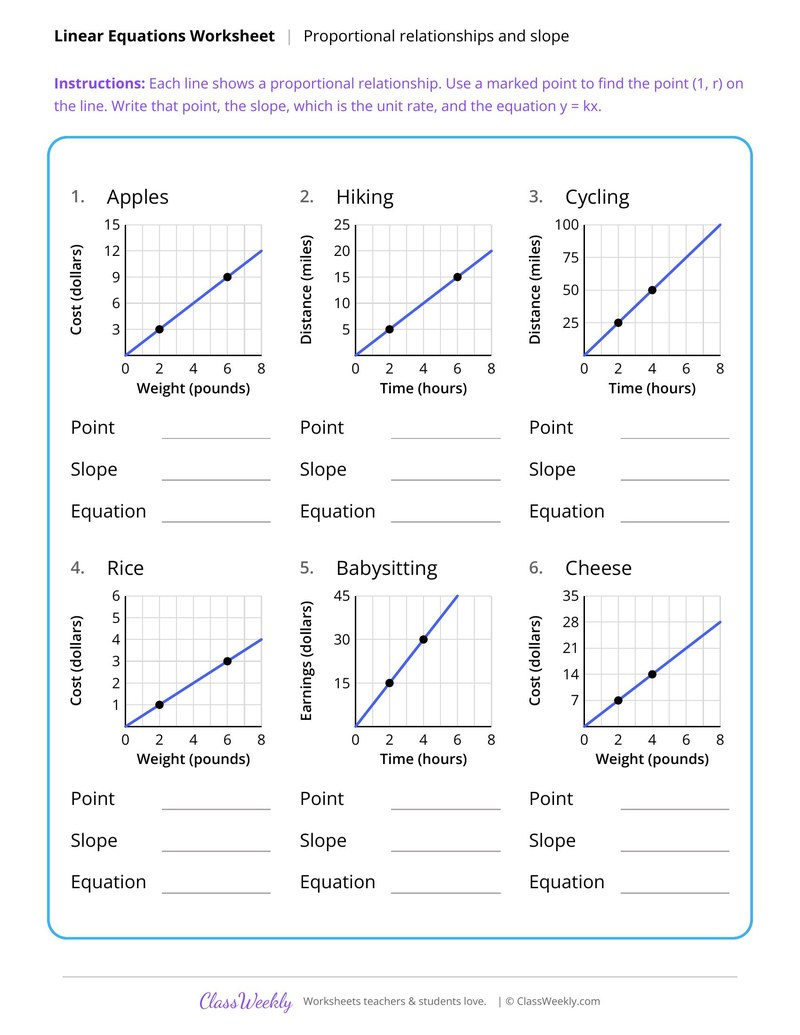
Find the Unit Rate as Slope From a Graph
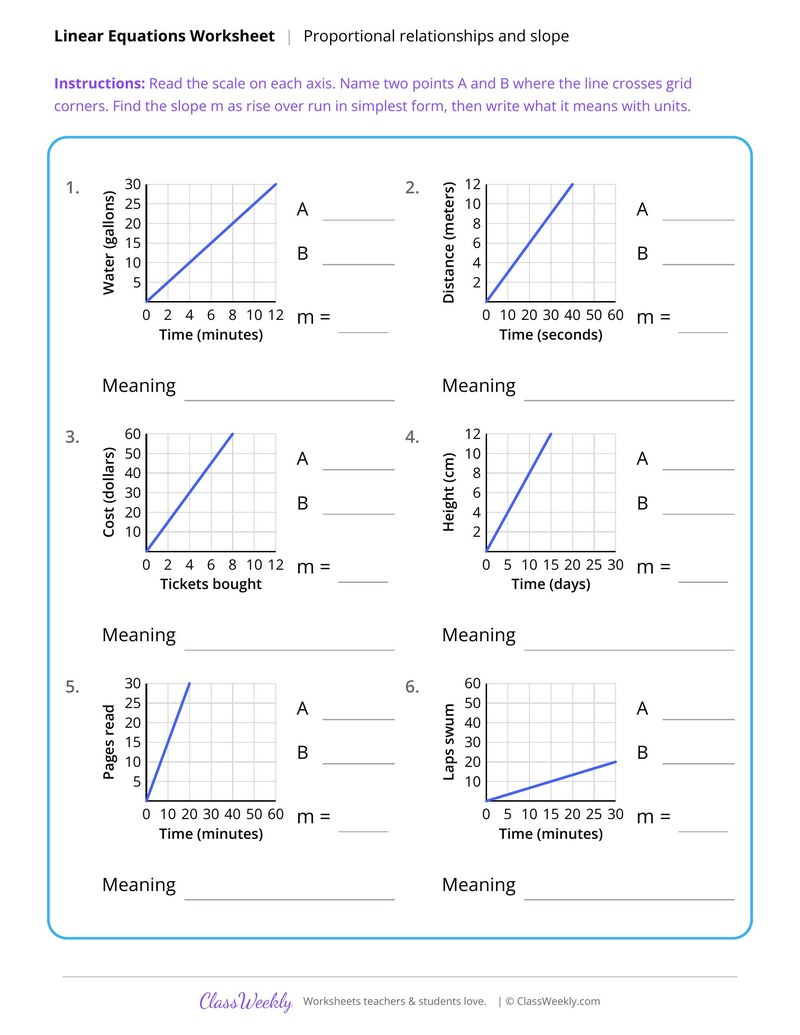
Unit Rate as Slope With Scaled Axes
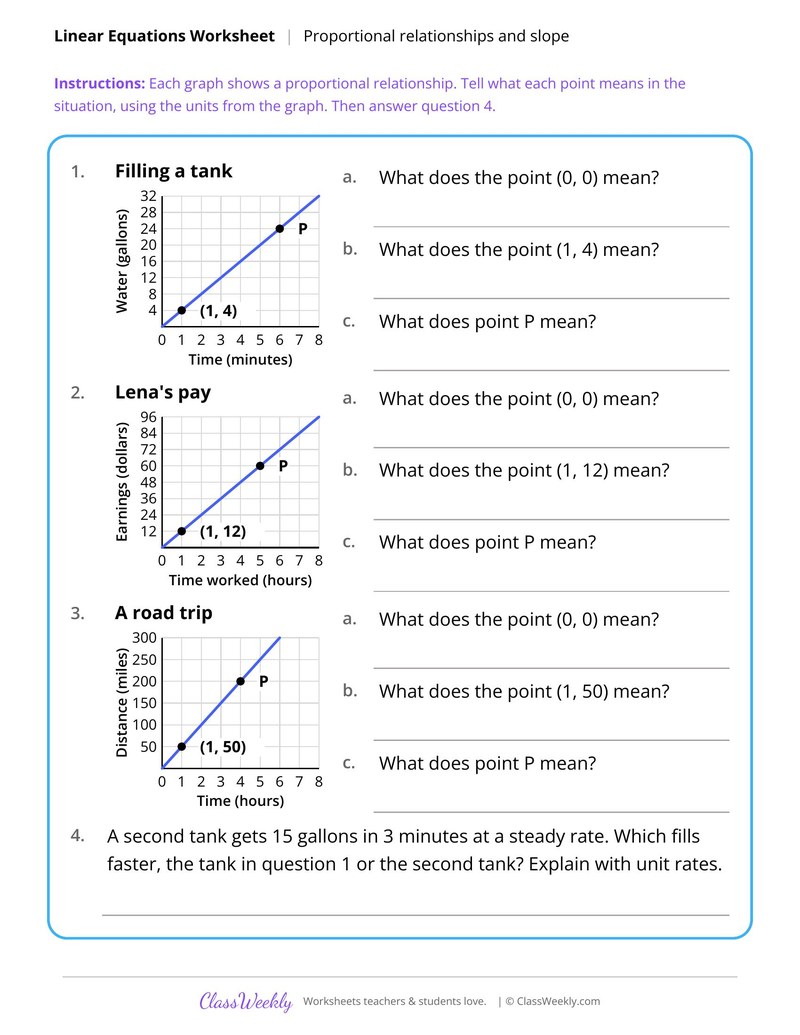
What Points Mean on a Proportional Graph
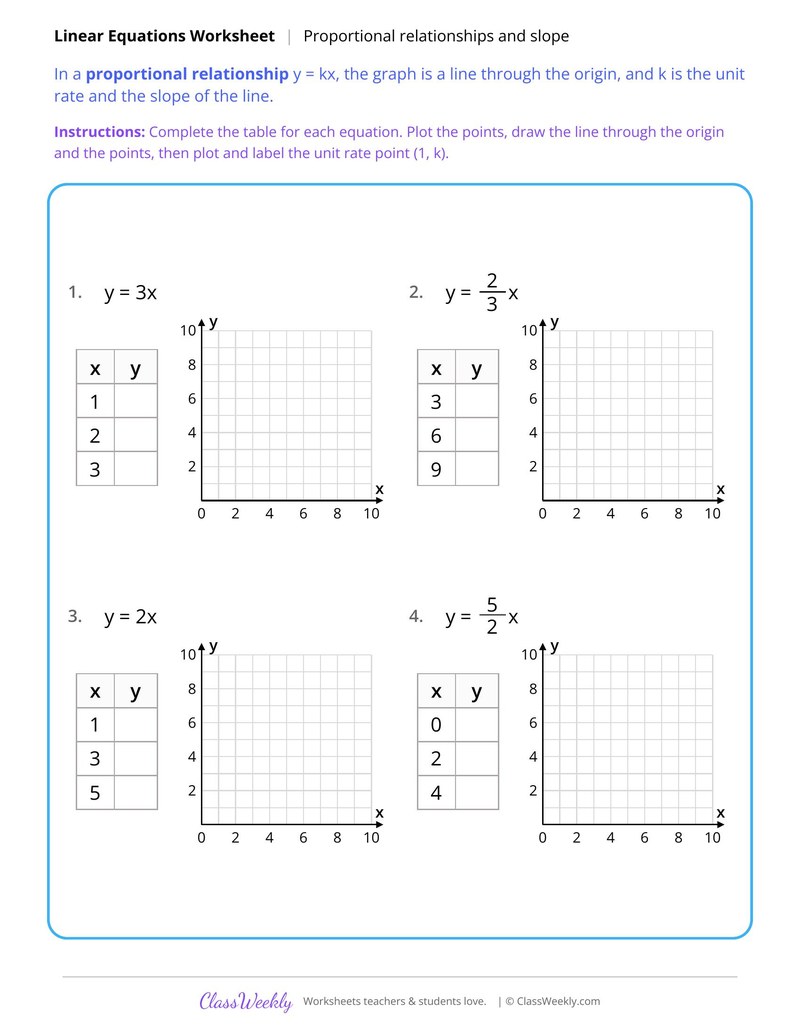
Graph Proportional Relationships From Equations
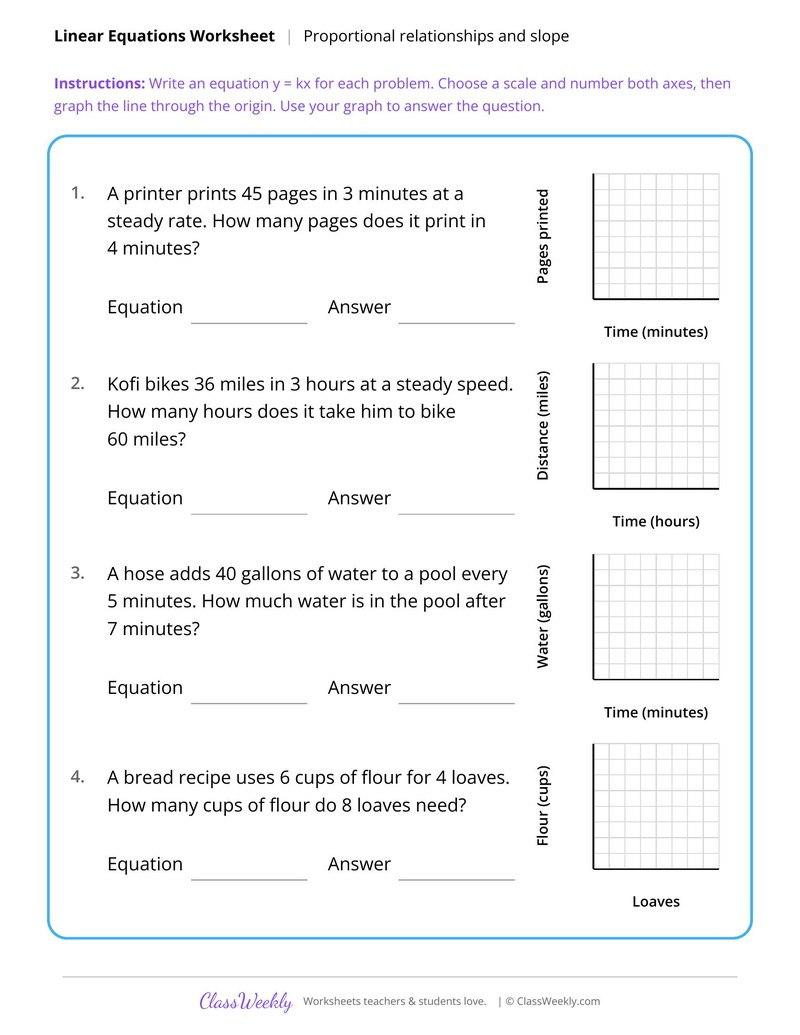
Graph Proportional Relationships From Word Problems
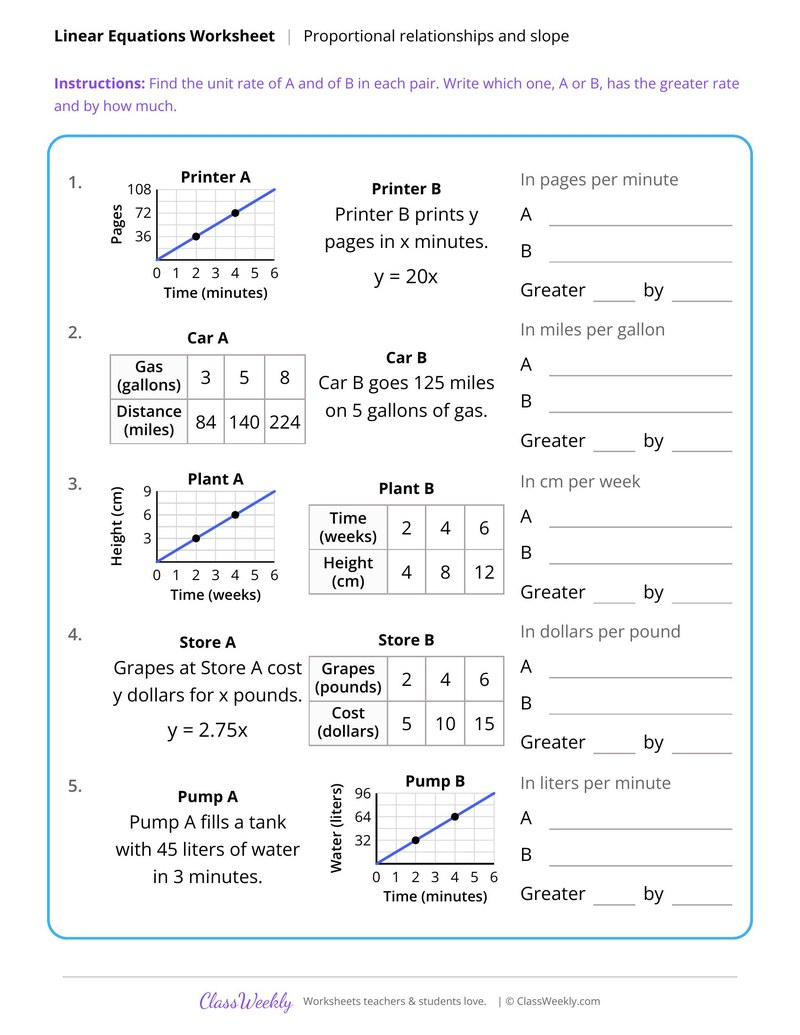
Compare Two Proportional Relationships
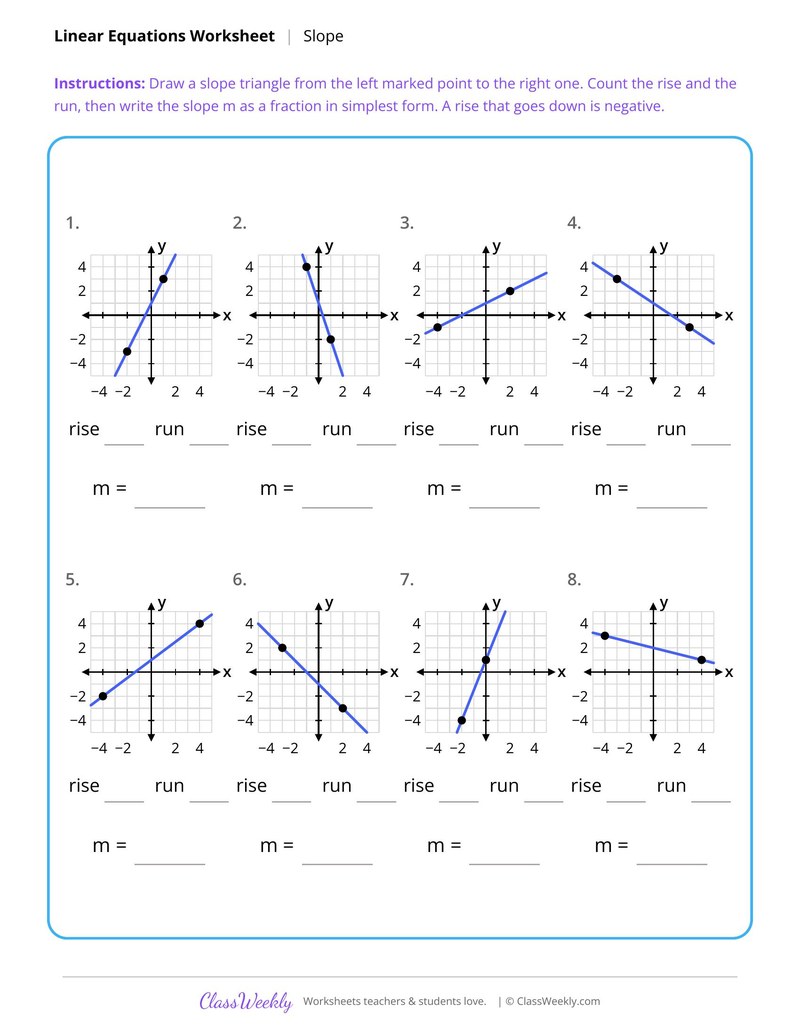
Find Slope From a Graph, Rise Over Run
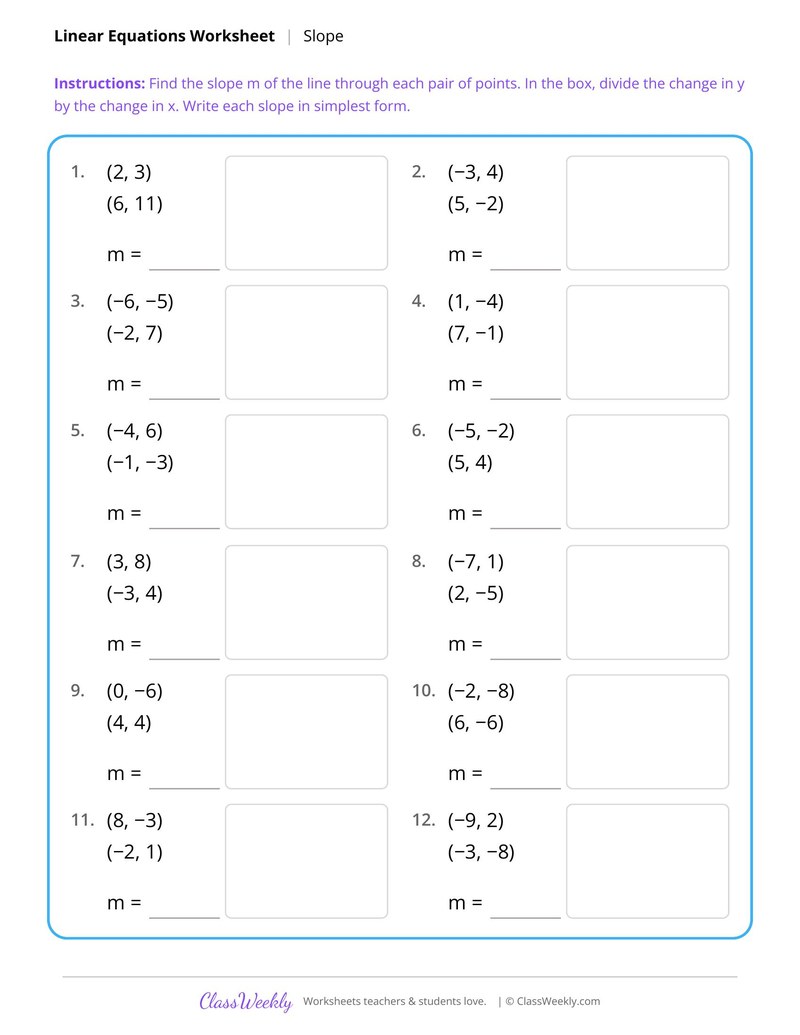
Find Slope From Two Points, Integer Coordinates
Curriculum Links
Common Core State Standards
Expressions and Equations · 8th Grade
Standard: Graph proportional relationships, interpreting the unit rate as the slope of the graph. Compare two different proportional relationships represented in different ways.
View all 8.EE.B.5 worksheets →Find this in the curriculum
Browse the grade, subject, and topic this belongs to.
FAQ
How do I use this proportional relationships and slope worksheet?
⌄
Begin with the two reading sheets so students connect slope and unit rate. Then move to graphing and finish with the comparison sheet.
What does this worksheet teach?
⌄
Check that y over x is constant in tables for pages printed and cups of flour, then graph and write y = kx. The directions on the page read: Find y over x for each row to check that the ratio is constant. Label both axes, plot the points from the table and draw the line through the origin. Then write the equation y = kx. An answer key is included.
Can I use this proportional relationships and slope worksheet for homeschool or classroom?
⌄
Yes, both. We made it for 8th grade linear equations, and it works the same at home or at school. At home, a student can work through it alone and then go over it with you, which shows quickly what is solid and what needs another look. In class it works as independent practice, homework or a warm-up, and you can print one copy or a full set.
Why is the unit rate the slope of a proportional graph?
⌄
The line passes through (0, 0) and (1, k), so it rises k units for each 1 unit it runs. That rise over run is the slope, and it is also the amount for one unit. On the apples graph, it is the cost of one pound.
What does the point (0, 0) mean on a proportional graph?
⌄
It means zero of one quantity matches zero of the other, such as 0 hours worked and 0 dollars earned. What Points Mean on a Proportional Graph asks students to explain this point for each graph.
How do you compare two proportional relationships shown in different ways?
⌄
Find the unit rate of each one, whether it comes from a graph, a table, an equation or a sentence. Compare the two numbers with units. Compare Two Proportional Relationships also asks by how much one is greater.
Ratings & Reviews
No reviews yet. Be the first to share what you think.
Reviews are for ClassWeekly members.
Make a Request
Spotted something to fix, or want a worksheet we don't have yet? Tell us and we'll make it.
Worksheet Details
| Grade | 8th Grade |
| Subject | Math |
| Topic | Linear Equations |
| Standard | 8.EE.B.5 |
| Pages | 1 page |
| Difficulty | Medium |
What is ClassWeekly?
ClassWeekly offers free worksheets and printable learning resources for kids, from preschool up. All worksheets are aligned to Common Core, NGSS, and C3 Framework standards and designed by educators. Become a member to access the full library and download unlimited PDFs.
Find the Unit Rate as Slope From a Graph
Unit Rate as Slope With Scaled Axes
What Points Mean on a Proportional Graph
Graph Proportional Relationships From Equations
Graph Proportional Relationships From Word Problems
Compare Two Proportional Relationships
Find Slope From a Graph, Rise Over Run
Find Slope From Two Points, Integer Coordinates