Map a Groundwater Plume From Well Data
Written by Adi Ackerman, Head Teacher
"Map a Groundwater Plume From Well Data" is written for 8th Grade (Ages 13-14), and it covers NGSS MS-ESS3-3. A 7th grader who is already steady on Earth systems can use it too, and an older student can use it as a short review.
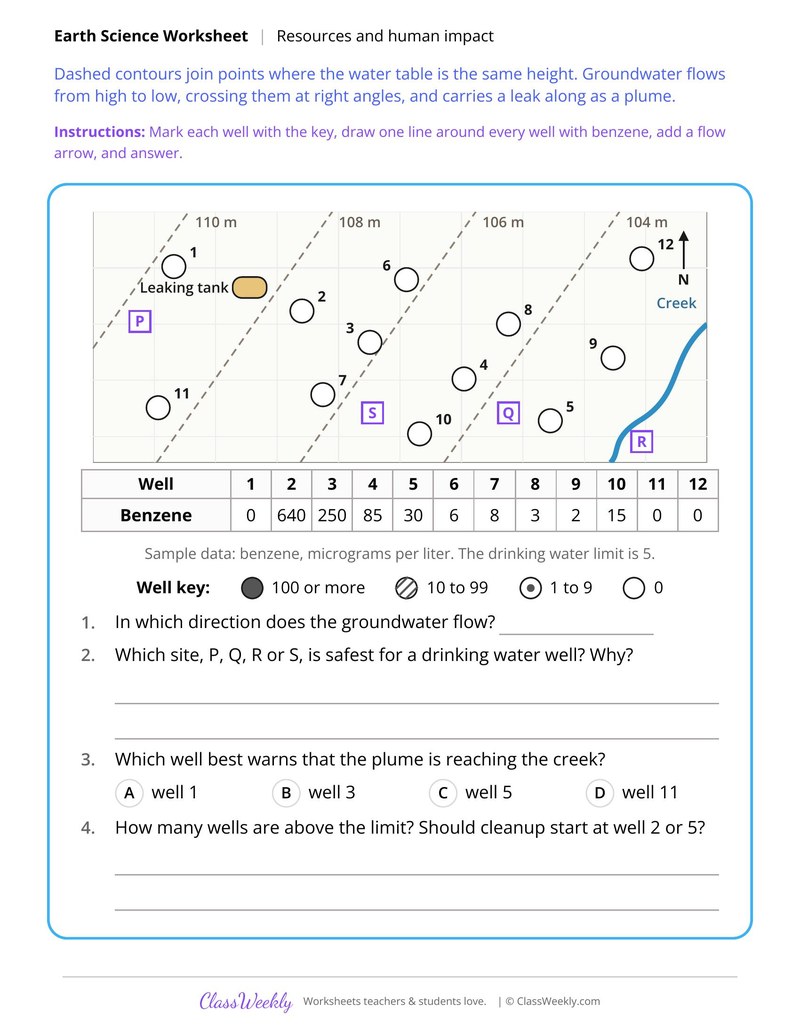
8th grade science worksheet: mark benzene levels in 12 wells, outline the plume from a leaking tank and pick a safe well site. Answer key included. Part of our resources and human impact earth systems collection. Aligned to NGSS standards.
How do I use this worksheet?
Pair the case studies with the data sheets, then ask students to compare a problem with its fix. The groundwater and runoff sheets work well as map and graph labs.
What students will practice
- Students will mark each well by benzene level using the key and outline the plume.
- Students will use water table contours to draw the direction of groundwater flow.
- Students will choose the safest site for a drinking water well and explain the choice.
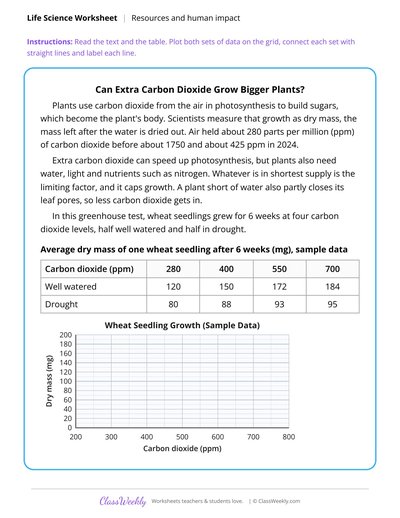
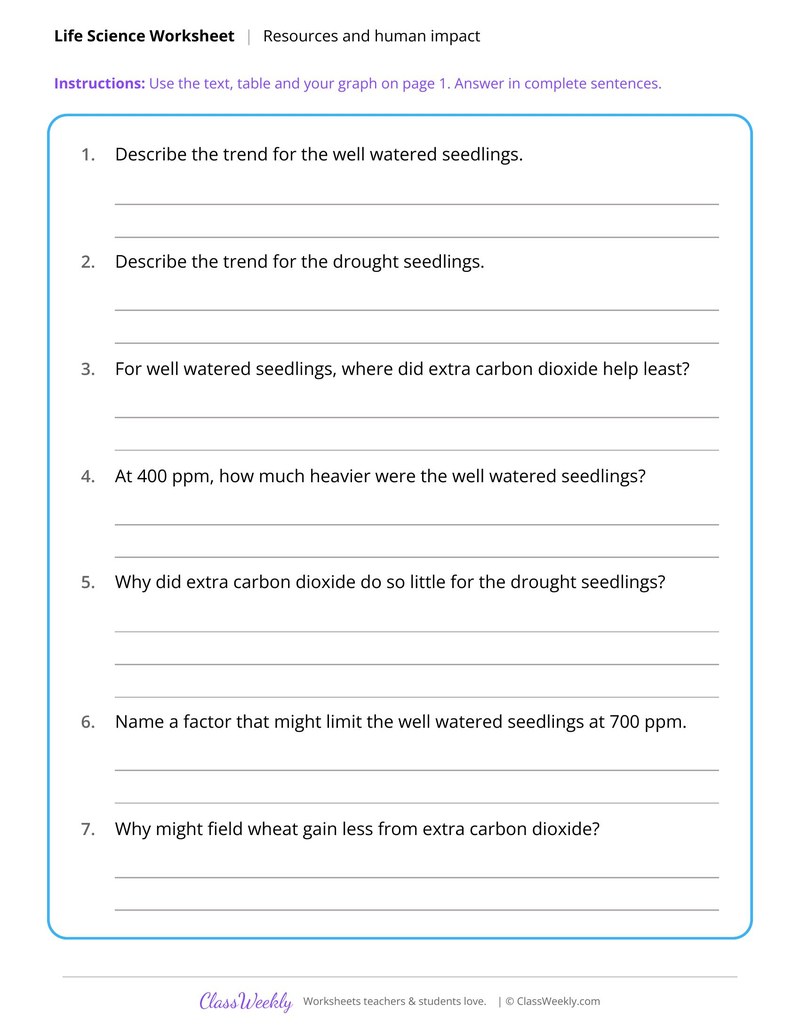
Plant Growth Under Rising Carbon Dioxide
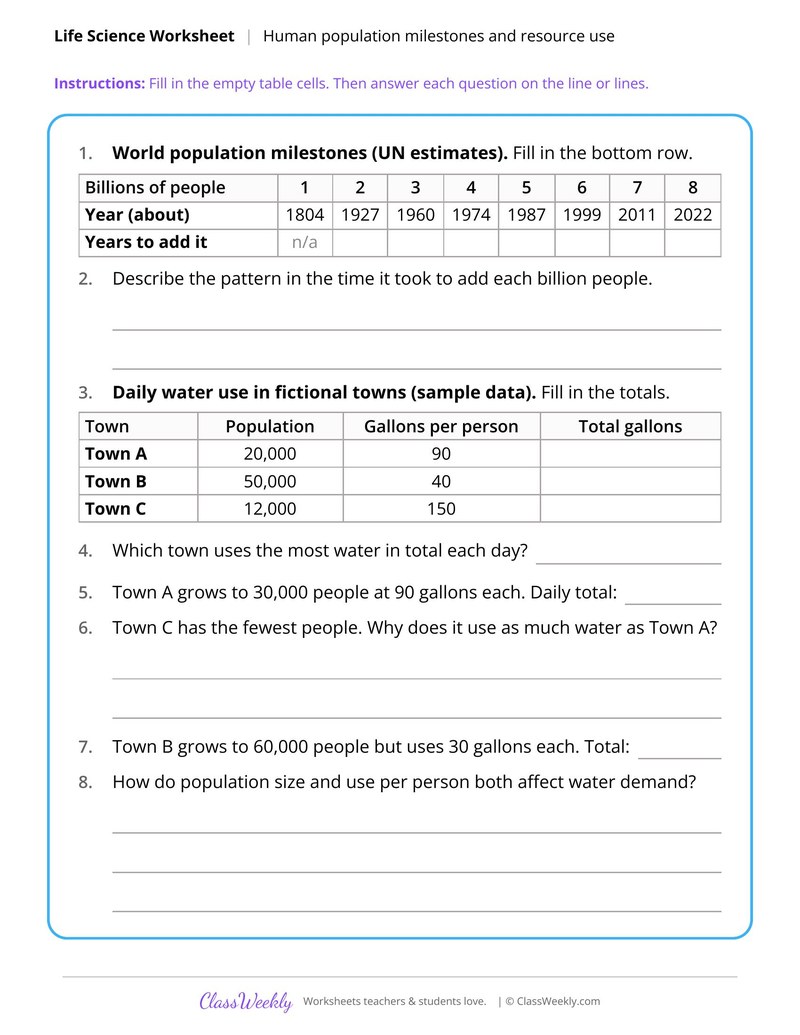
Human Population Milestones and Resource Use
Cover Crop Runoff and Nitrate Data
Burmese Pythons and Everglades Mammals
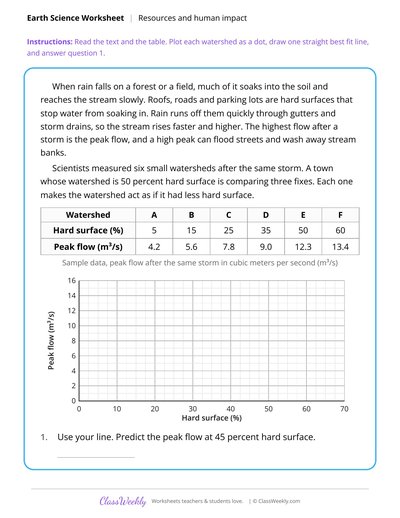
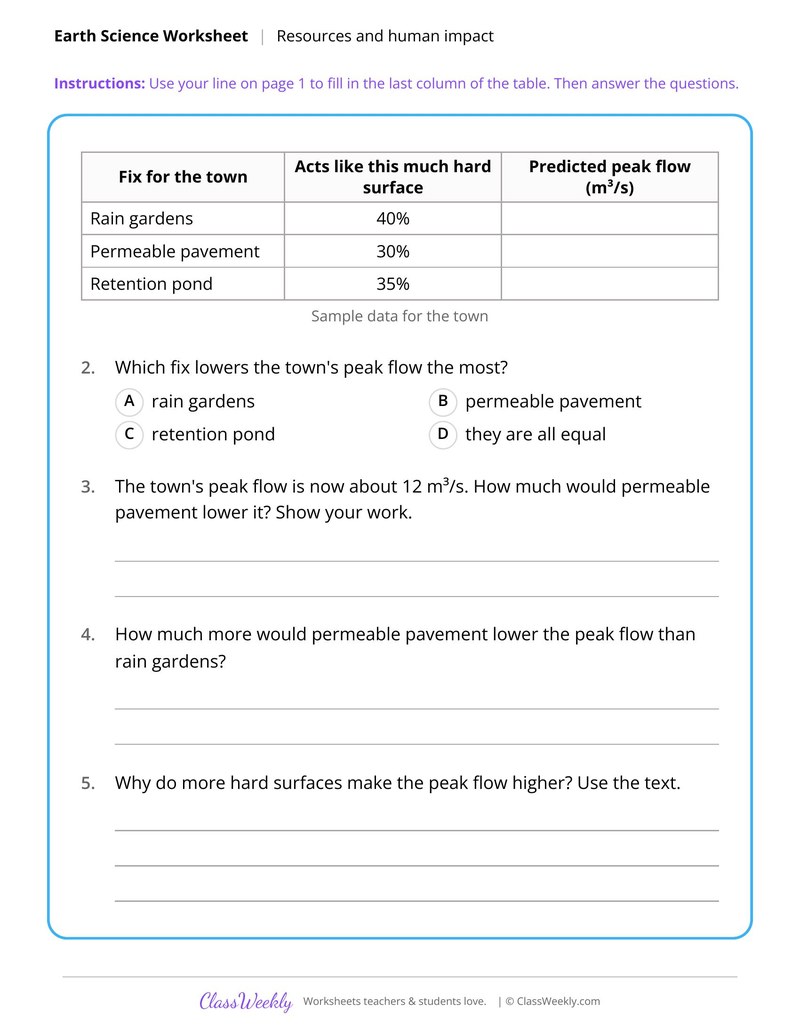
Pavement Cover and Storm Runoff Data
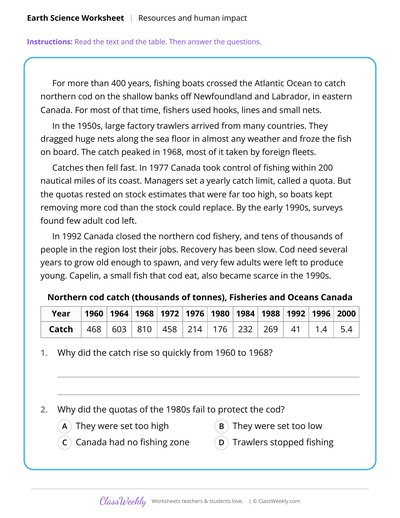
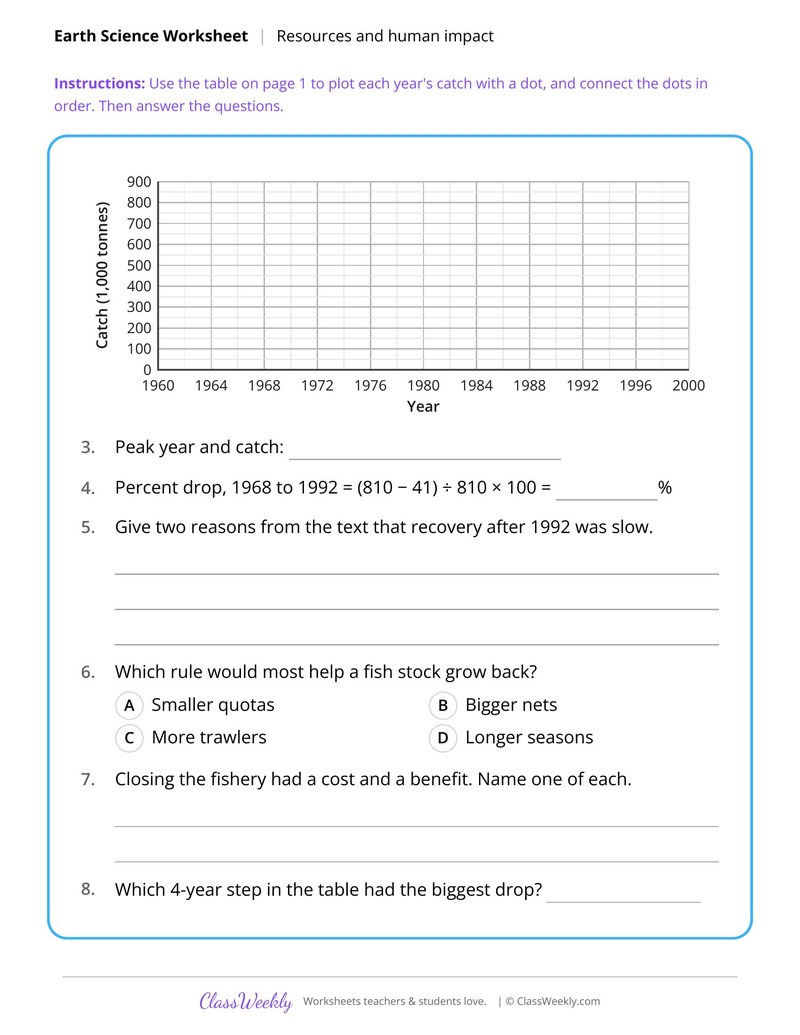
Atlantic Cod Collapse and Fishing Limits
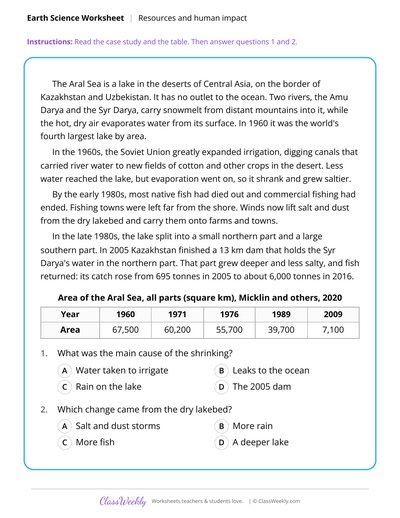
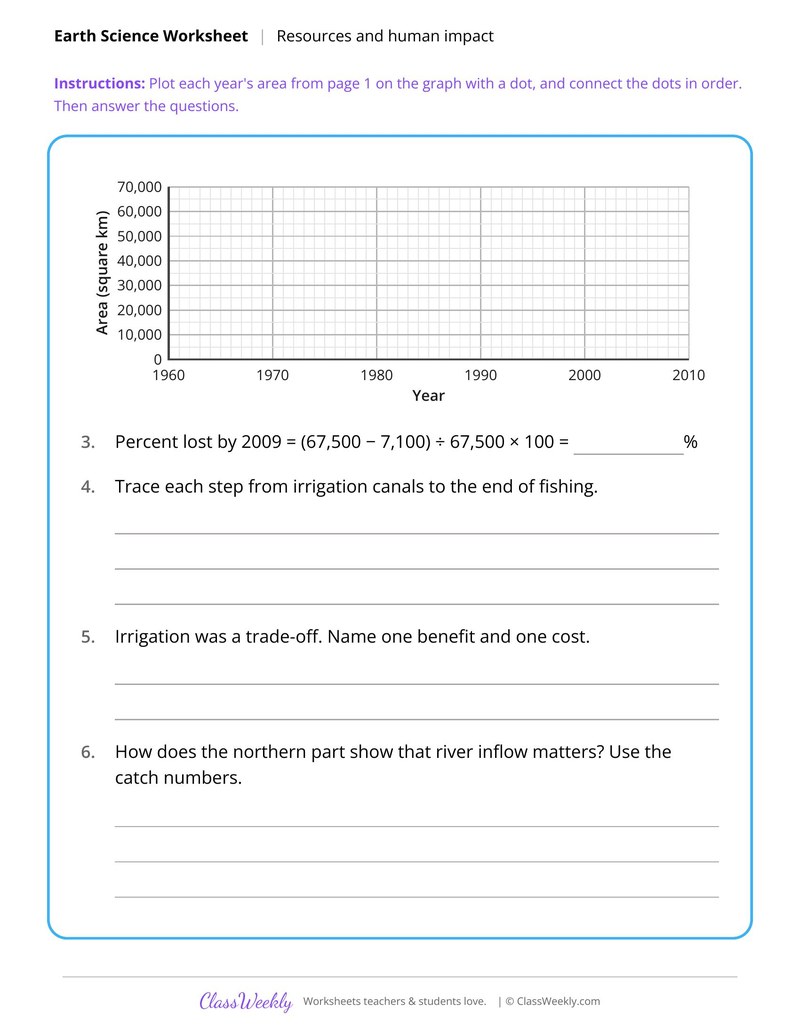
Aral Sea Shrinking Case Study
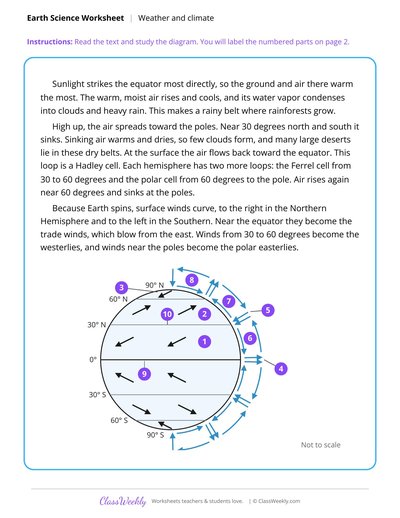
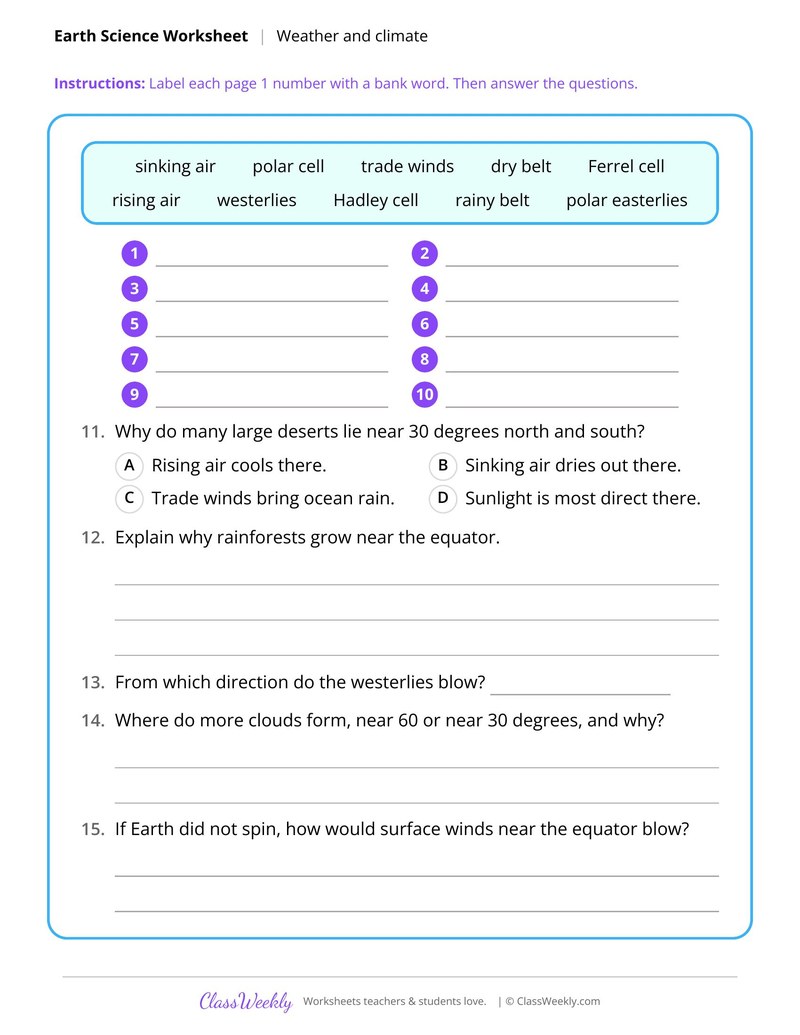
Label Global Wind Belts and Circulation Cells
Curriculum Links
Next Generation Science Standards
Science · 8th Grade
Find this in the curriculum
Browse the grade, subject, and topic this belongs to.
FAQ
How do I use this resources and human impact worksheet?
⌄
Pair the case studies with the data sheets, then ask students to compare a problem with its fix. The groundwater and runoff sheets work well as map and graph labs.
What does this worksheet teach?
⌄
Mark benzene levels in 12 wells, outline the plume from a leaking tank and pick a safe well site. Dashed contours join points where the water table is the same height. Groundwater flows from high to low, crossing them at right angles, and carries a leak along as a plume. The directions on the page read: Mark each well with the key, draw one line around every well with benzene, add a flow arrow, and answer. An answer key is included.
Can I use this resources and human impact worksheet for homeschool or classroom?
⌄
Yes, both. We made it for 8th grade Earth systems, and it works the same at home or at school. At home, a student can work through it alone and then go over it with you, which shows quickly what is solid and what needs another look. In class it works as independent practice, homework or a warm-up, and you can print one copy or a full set.
Why did the Atlantic cod fishery collapse?
⌄
Factory trawlers caught huge amounts of cod after the 1950s, and later quotas rested on stock estimates that were far too high. By the early 1990s few adult cod were left, and Canada closed the fishery in 1992. Atlantic Cod Collapse and Fishing Limits graphs the catch.
Why did the Aral Sea shrink?
⌄
In the 1960s the Soviet Union dug canals to carry river water to new cotton fields, so less water reached the lake while evaporation went on. The lake shrank and grew saltier, and commercial fishing ended. Aral Sea Shrinking Case Study graphs its area over time.
How do cover crops reduce pollution?
⌄
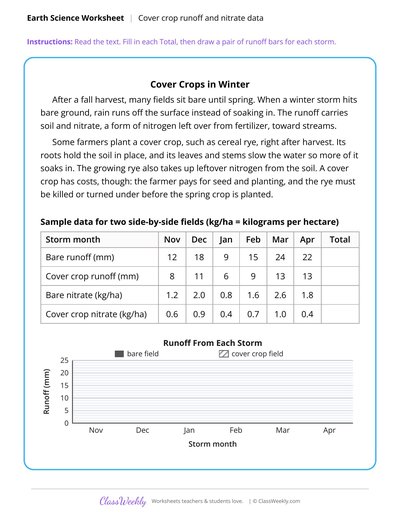
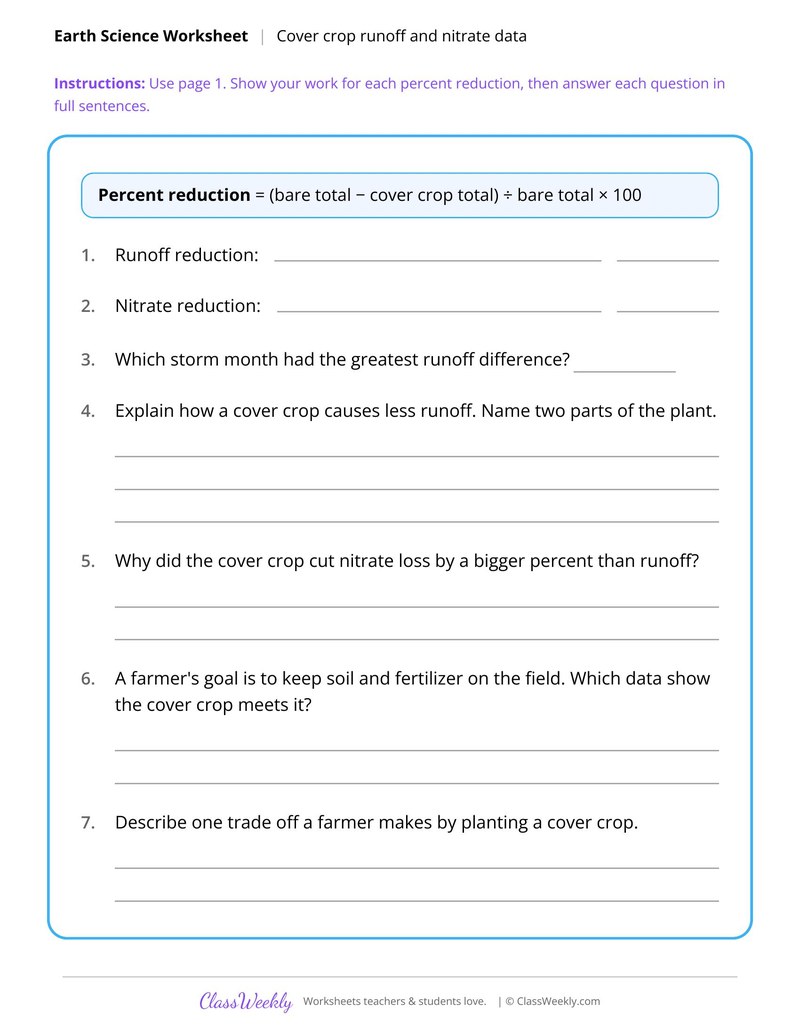
A cover crop such as cereal rye holds soil in place, slows water so more soaks in and takes up leftover nitrogen. That cuts runoff and the nitrate it carries to streams. The cover crop sheet has students find the percent reduction from sample data.
Ratings & Reviews
No reviews yet. Be the first to share what you think.
Reviews are for ClassWeekly members.
Make a Request
Spotted something to fix, or want a worksheet we don't have yet? Tell us and we'll make it.
Worksheet Details
| Grade | 8th Grade |
| Subject | Science |
| Topic | Earth Systems |
| Standard | MS-ESS3-3 |
| Pages | 1 page |
| Difficulty | Medium |
What is ClassWeekly?
ClassWeekly offers free worksheets and printable learning resources for kids, from preschool up. All worksheets are aligned to Common Core, NGSS, and C3 Framework standards and designed by educators. Become a member to access the full library and download unlimited PDFs.
Plant Growth Under Rising Carbon Dioxide
Human Population Milestones and Resource Use
Cover Crop Runoff and Nitrate Data
Burmese Pythons and Everglades Mammals
Pavement Cover and Storm Runoff Data
Atlantic Cod Collapse and Fishing Limits
Aral Sea Shrinking Case Study
Label Global Wind Belts and Circulation Cells