Transportation History Timeline
Written by Adi Ackerman, Head Teacher
"Transportation History Timeline" is written for 6th Grade (Ages 11-12). If your student is a year younger but already steady on Sources, Data and Research Skills, the page still works. You may just need to read the instructions out loud. And if they are older and timelines, causes and data never quite stuck, this is a short review rather than busywork.
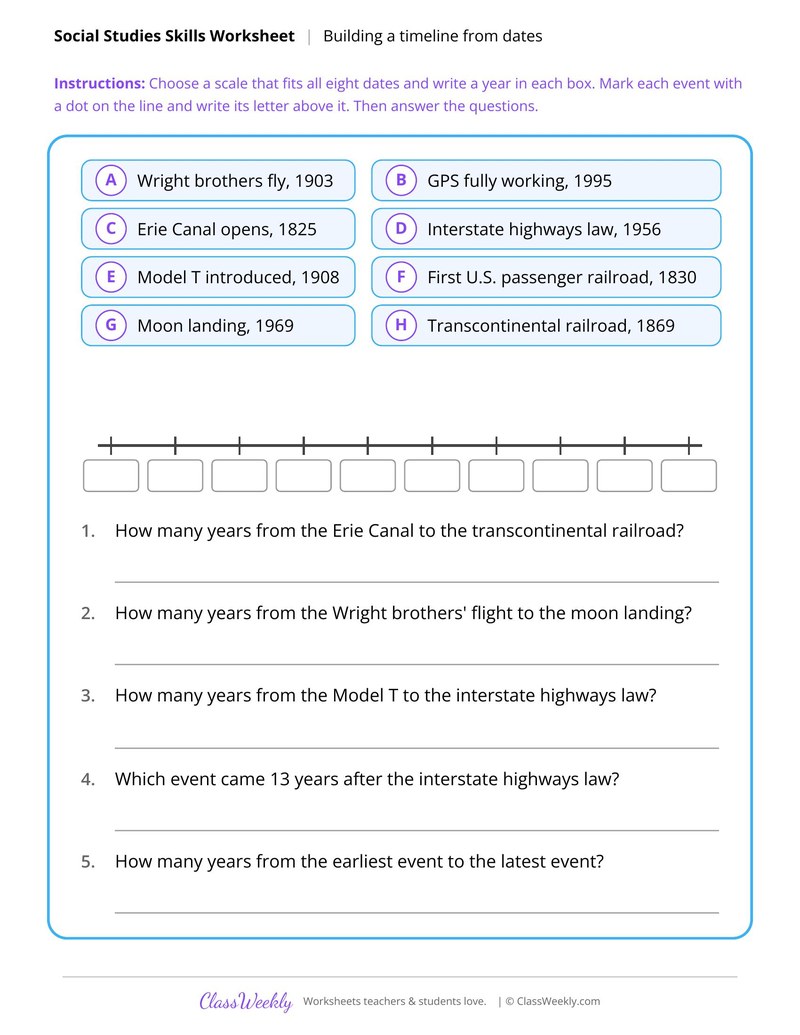
6th grade social studies worksheet: build a timeline of 8 events from the Erie Canal to GPS, then count the years between them. Answer key included. Part of our timelines, causes and data collection.
How do I use this worksheet?
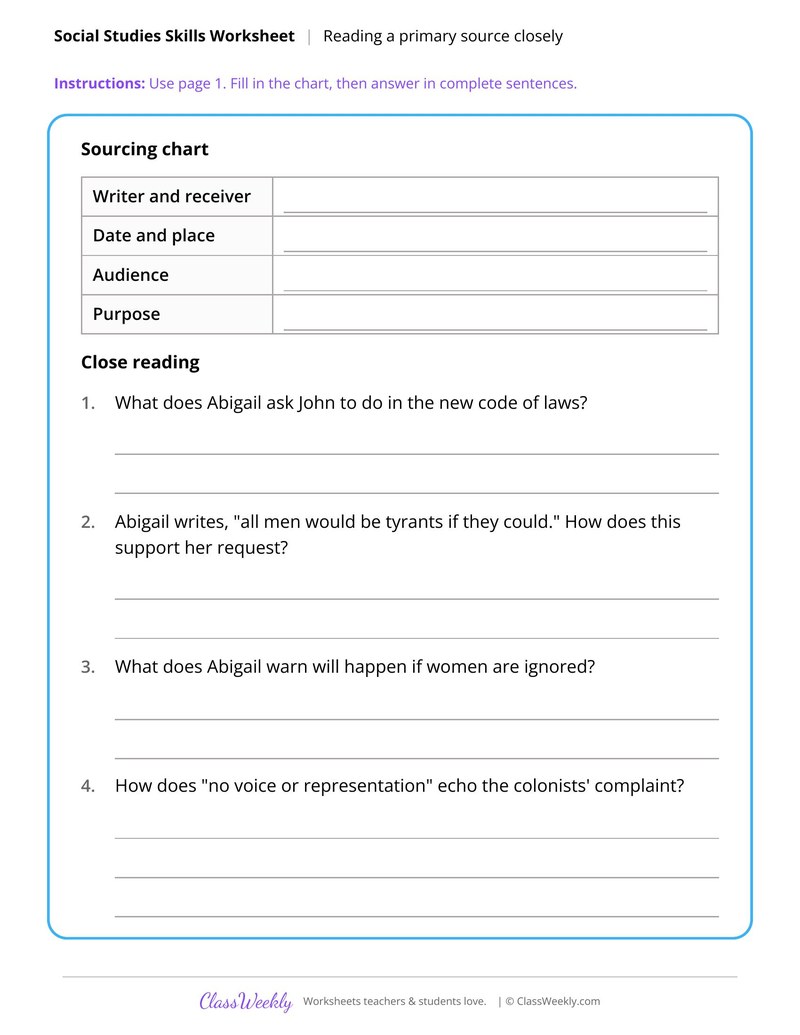
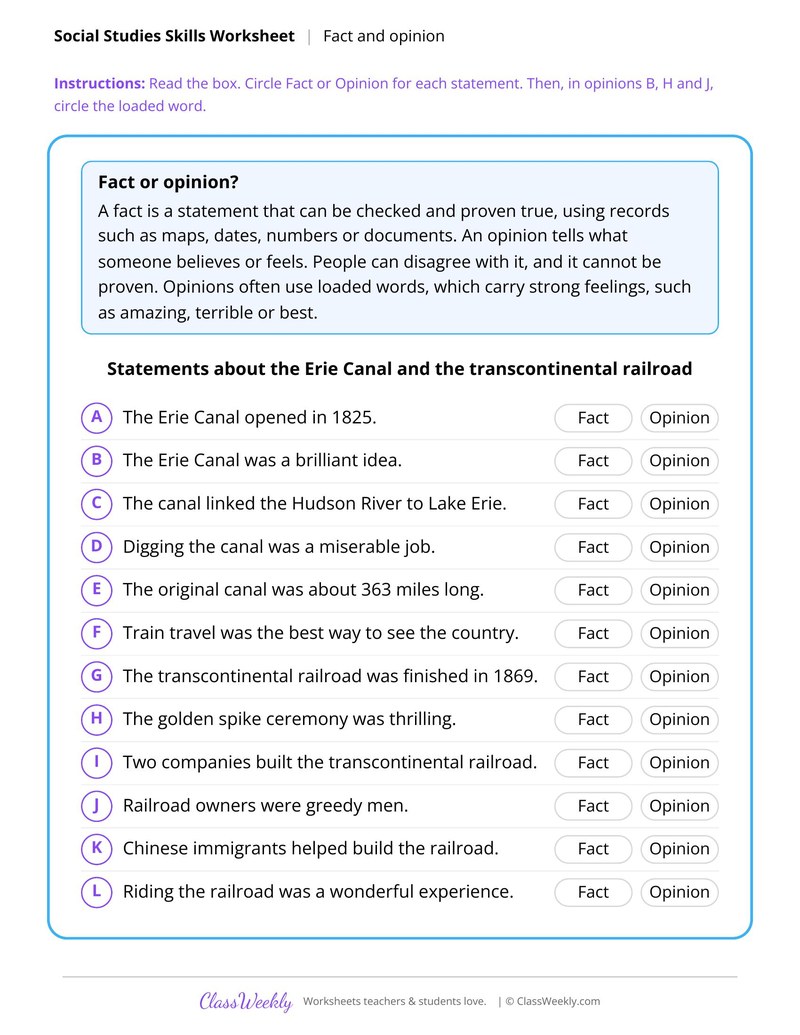
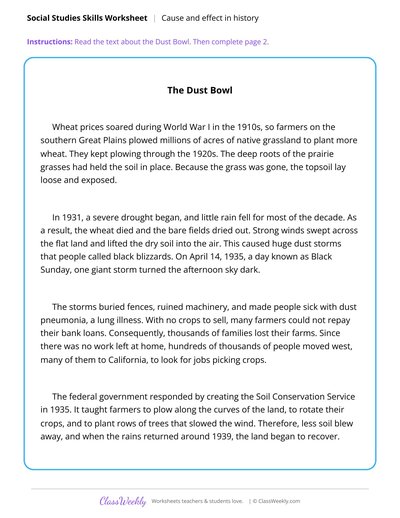
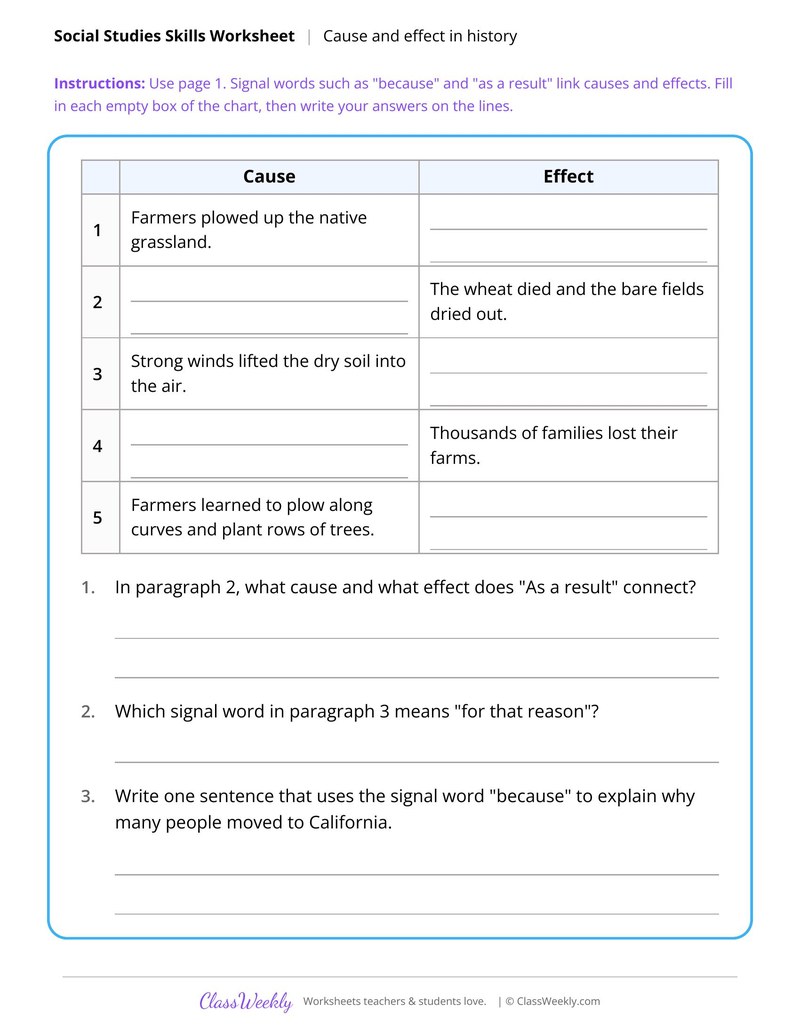
Have students underline signal words while reading the Dust Bowl text before filling in the chart. For the timeline and census sheets, check each student's scale or first few points before they continue.
What students will practice
- Students will choose an even scale that fits eight transportation dates from 1825 to 1995.
- Students will mark each event on a timeline with a dot and its letter.
- Students will calculate the years between events such as the Model T and the interstate highways law.
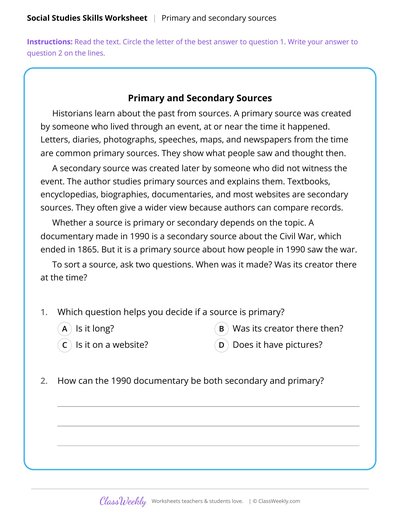
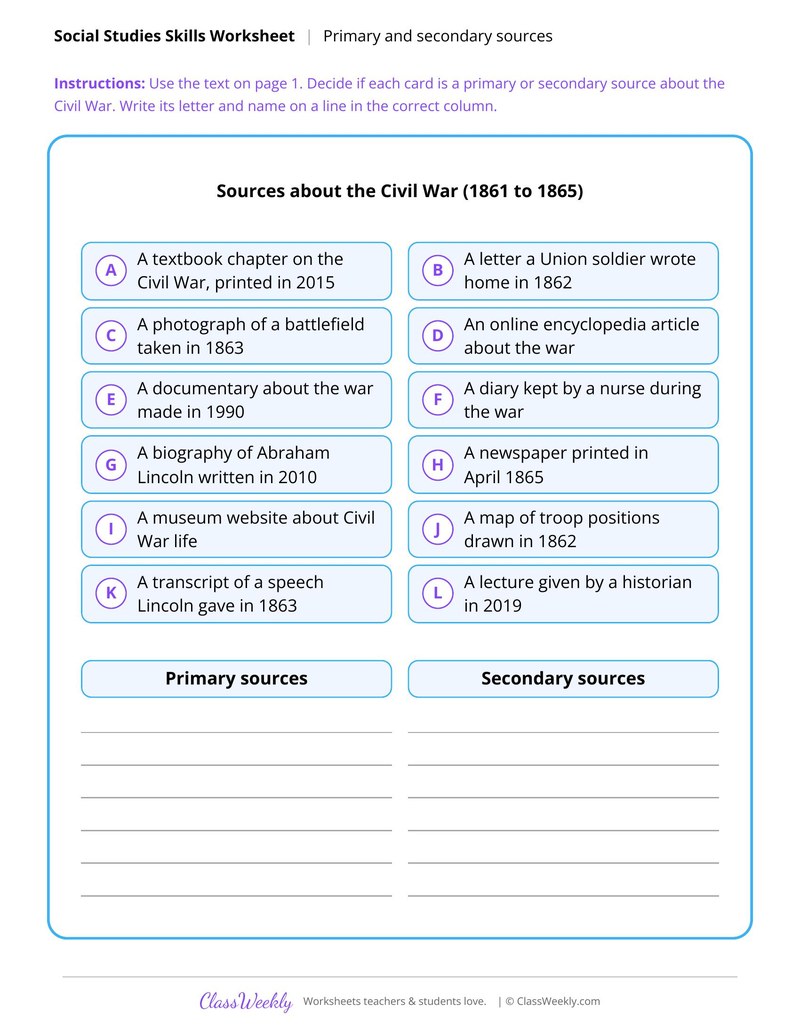
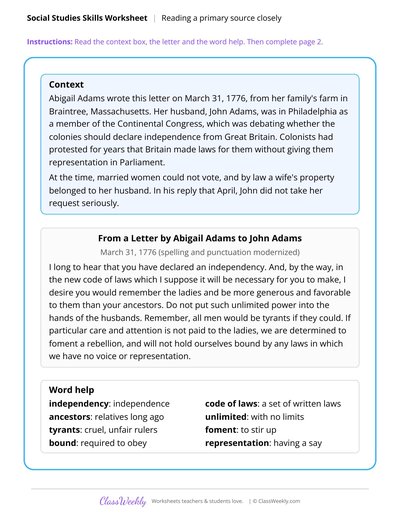
Curriculum Links
Find this in the curriculum
Browse the grade, subject, and topic this belongs to.
FAQ
How do I use this timelines, causes and data worksheet?
⌄
Have students underline signal words while reading the Dust Bowl text before filling in the chart. For the timeline and census sheets, check each student's scale or first few points before they continue.
What does this worksheet teach?
⌄
Build a timeline of 8 events from the Erie Canal to GPS, then count the years between them. The directions on the page read: Choose a scale that fits all eight dates and write a year in each box. Mark each event with a dot on the line and write its letter above it. Then answer the questions. An answer key is included.
Can I use this timelines, causes and data worksheet for homeschool or classroom?
⌄
Yes, both. We made it for 6th Grade Sources, Data and Research Skills, and the page works the same whether it lands on a kitchen table or a center rotation. At home, most families go through it together and talk the answers out loud, and that talking is where most of the learning happens with timelines, causes and data. In class it runs well as independent work while you pull a small group. Print one copy or thirty, whichever the day needs.
What caused the Dust Bowl?
⌄
The reading explains that farmers plowed up native grassland, so the topsoil lay loose and exposed. A severe drought began in 1931, and strong winds lifted the dry soil into huge dust storms called black blizzards.
How do you choose a scale for a timeline?
⌄
Pick an even interval that fits every date from earliest to latest. On Transportation History Timeline the dates run from 1825 to 1995, and the answer key shows a sample scale in steps of 20 years while accepting any even scale that fits.
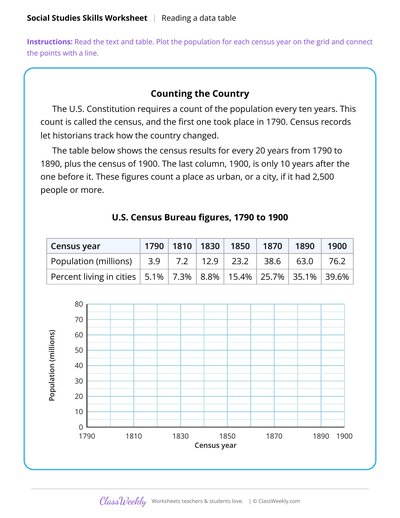
What is a census and what can it show?
⌄
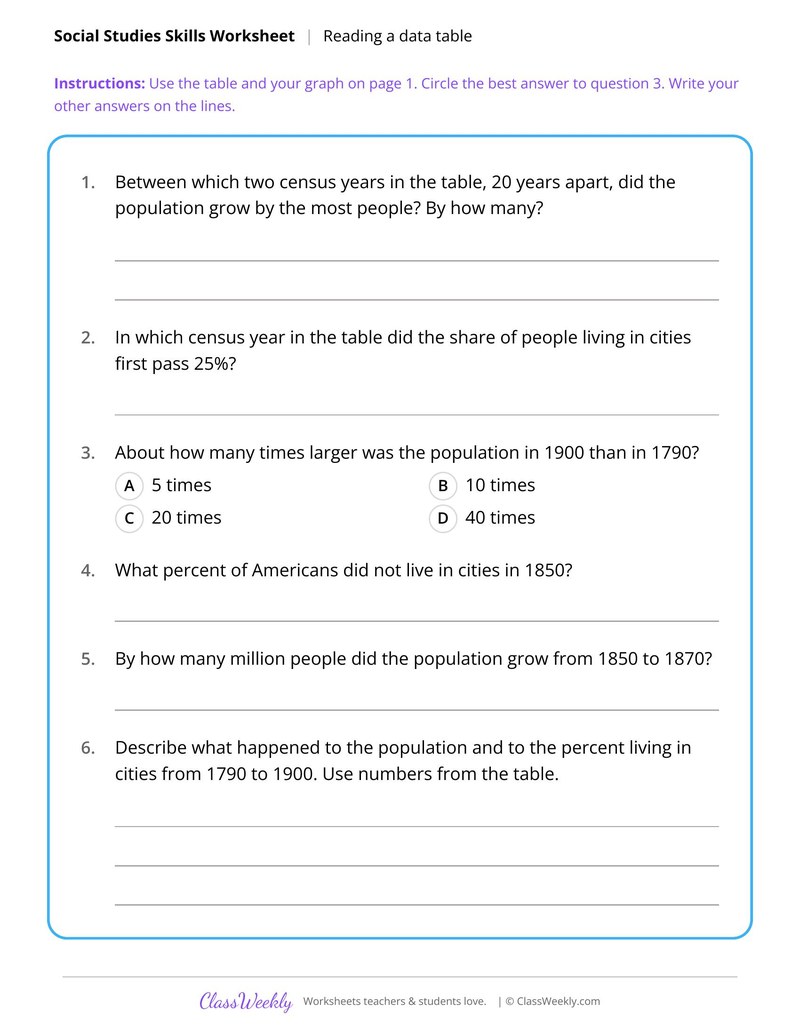
A census is a count of the population, which the U.S. Constitution requires every ten years. The sheet's table shows population growing from 3.9 million in 1790 to 76.2 million in 1900, and the percent living in cities rising from 5.1% to 39.6%.
Ratings & Reviews
No reviews yet. Be the first to share what you think.
Reviews are for ClassWeekly members.
Make a Request
Spotted something to fix, or want a worksheet we don't have yet? Tell us and we'll make it.
Worksheet Details
| Grade | 6th Grade |
| Subject | Social Studies |
| Topic | Sources, Data and Research Skills |
| Pages | 1 page |
| Difficulty | Medium |
What is ClassWeekly?
ClassWeekly offers free worksheets and printable learning resources for kids, from preschool up. All worksheets are aligned to Common Core, NGSS, and C3 Framework standards and designed by educators. Become a member to access the full library and download unlimited PDFs.