Graph Global Temperature Change Since 1880
Written by Adi Ackerman, Head Teacher
"Graph Global Temperature Change Since 1880" is written for 8th Grade (Ages 13-14), and it covers NGSS MS-ESS3-5. A 7th grader who is already steady on Earth systems can use it too, and an older student can use it as a short review.
2 pages in this set
8th grade science worksheet: graph NASA GISS temperature anomalies since 1880 and compare the early and recent trends. Answer key included. Part of our weather and climate earth systems collection. Aligned to NGSS standards.
How do I use this worksheet?
Start with the wind belt diagram, then use the temperature graph for a climate discussion. Finish with the cold front table and the storm surge map.
What students will practice
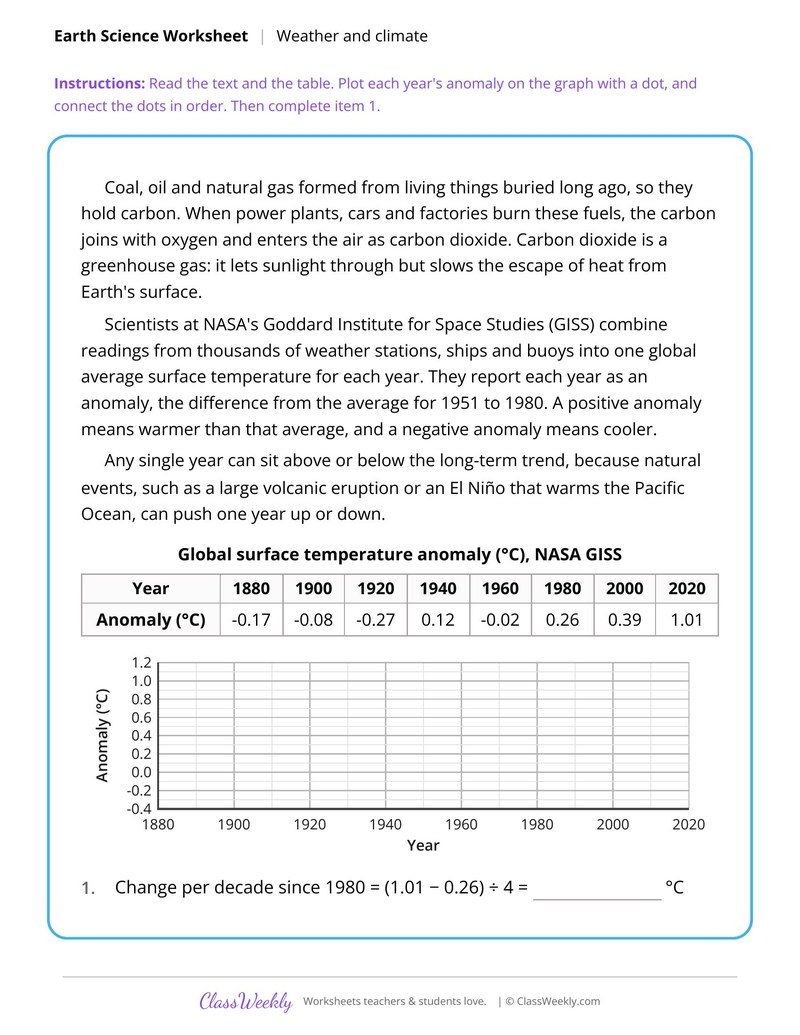
- Students will plot yearly global temperature anomalies and connect the points in order.
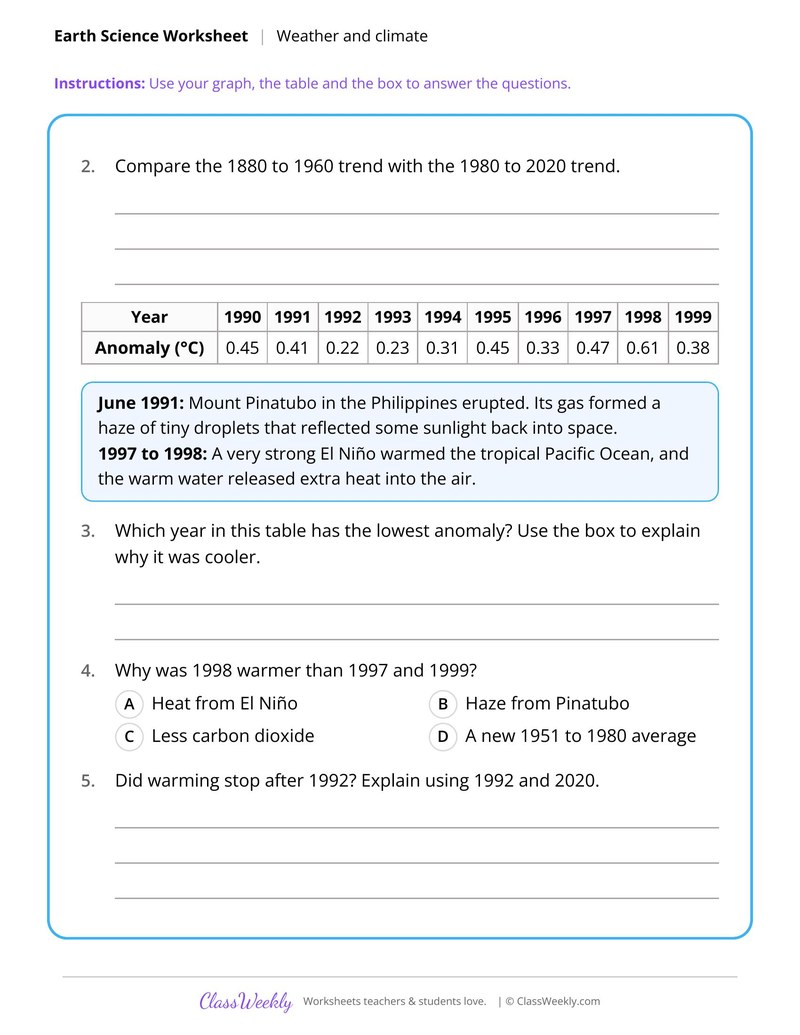
- Students will compare the 1880 to 1960 trend with the 1980 to 2020 trend.
- Students will explain how burning coal, oil and gas adds carbon dioxide to the air.
Curriculum Links
Next Generation Science Standards
Science · 8th Grade
Find this in the curriculum
Browse the grade, subject, and topic this belongs to.
FAQ
How do I use this weather and climate worksheet?
⌄
Start with the wind belt diagram, then use the temperature graph for a climate discussion. Finish with the cold front table and the storm surge map.
What does this worksheet teach?
⌄
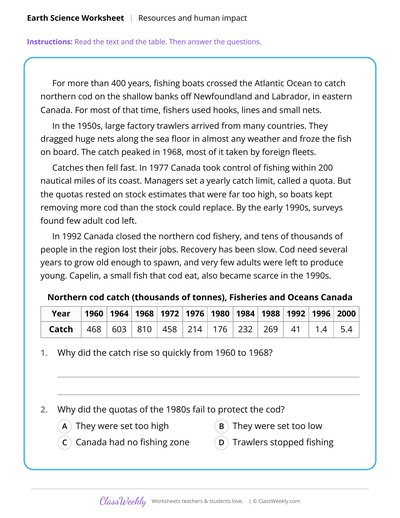
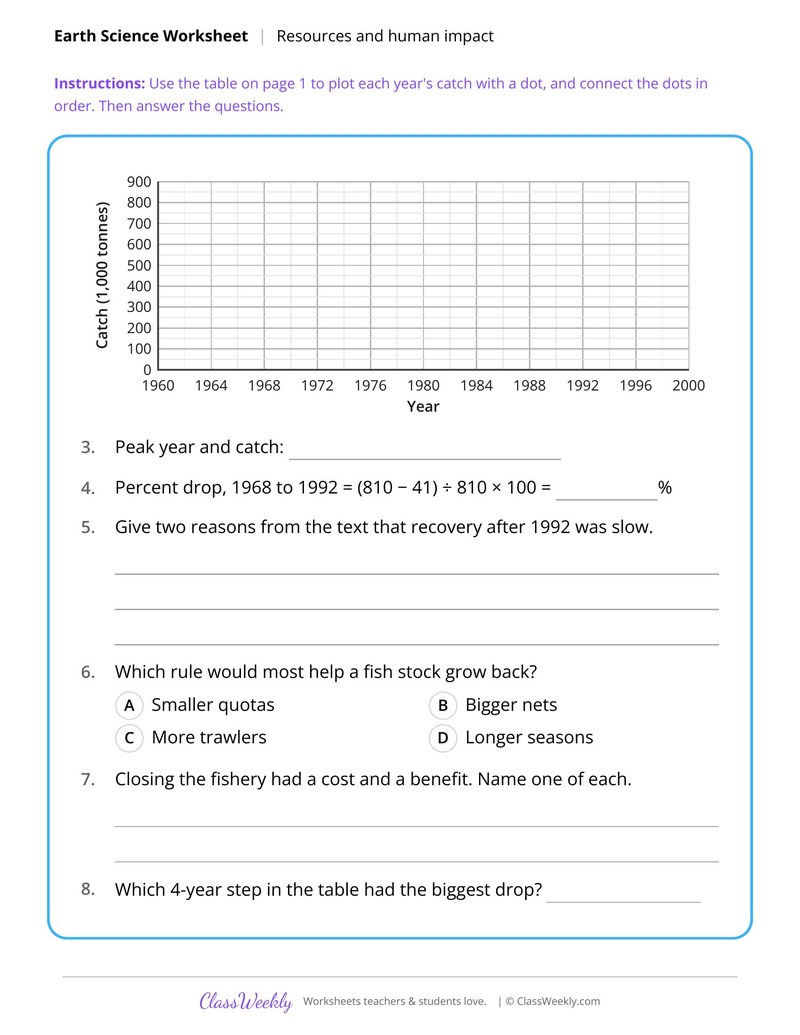
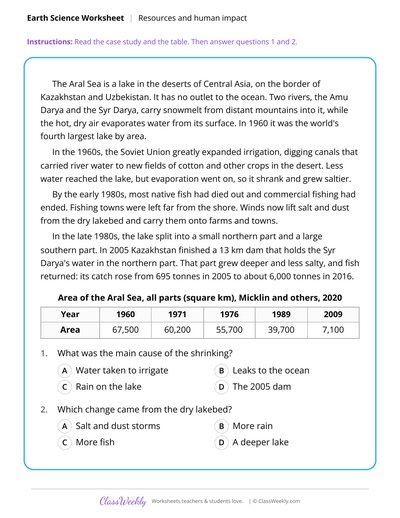
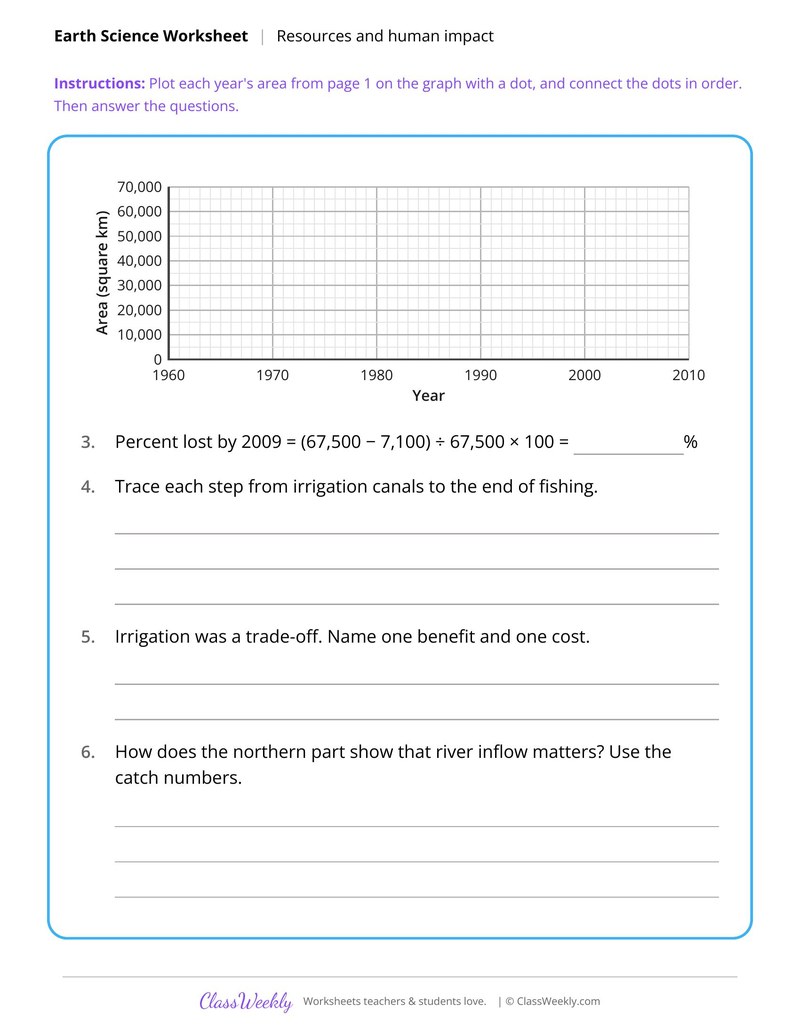
Graph NASA GISS temperature anomalies since 1880 and compare the early and recent trends. The directions on the page read: Read the text and the table. Plot each year's anomaly on the graph with a dot, and connect the dots in order. Then complete item 1. An answer key is included.
Can I use this weather and climate worksheet for homeschool or classroom?
⌄
Yes, both. We made it for 8th grade Earth systems, and it works the same at home or at school. At home, a student can work through it alone and then go over it with you, which shows quickly what is solid and what needs another look. In class it works as independent practice, homework or a warm-up, and you can print one copy or a full set.
What is a temperature anomaly?
⌄
It is the difference between a year's average temperature and a reference average, here 1951 to 1980. A positive anomaly means warmer than that average. Graph Global Temperature Change Since 1880 uses anomalies reported by NASA GISS.
What is storm surge?
⌄
Storm surge is seawater pushed toward the shore by a hurricane's strong winds, raising the water above the normal tide. Map Storm Surge Flooding by Elevation has students shade land that floods at 2, 4 and 6 m. They then choose a safe route from a school.
What are mT and cP air masses?
⌄
An mT air mass is warm and humid and comes from tropical seas. A cP air mass is cool and dry and comes from land to the north. When a cold front passes, cP air replaces mT air.
Ratings & Reviews
No reviews yet. Be the first to share what you think.
Reviews are for ClassWeekly members.
Make a Request
Spotted something to fix, or want a worksheet we don't have yet? Tell us and we'll make it.
Worksheet Details
| Grade | 8th Grade |
| Subject | Science |
| Topic | Earth Systems |
| Standard | MS-ESS3-5 |
| Pages | 2 pages |
| Difficulty | Medium |
What is ClassWeekly?
ClassWeekly offers free worksheets and printable learning resources for kids, from preschool up. All worksheets are aligned to Common Core, NGSS, and C3 Framework standards and designed by educators. Become a member to access the full library and download unlimited PDFs.