Community Helpers Count and Graph
Written by Adi Ackerman, Head Teacher
"Community Helpers Count and Graph" is written for 1st Grade (Ages 6-7), and it covers Common Core 1.MD.C.4. If your little one is a year younger but already steady on data & graphing, the page still works. You may just need to read the instructions out loud. And if they are older and bar graphs never quite stuck, this is a short review rather than busywork.
2 pages in this set
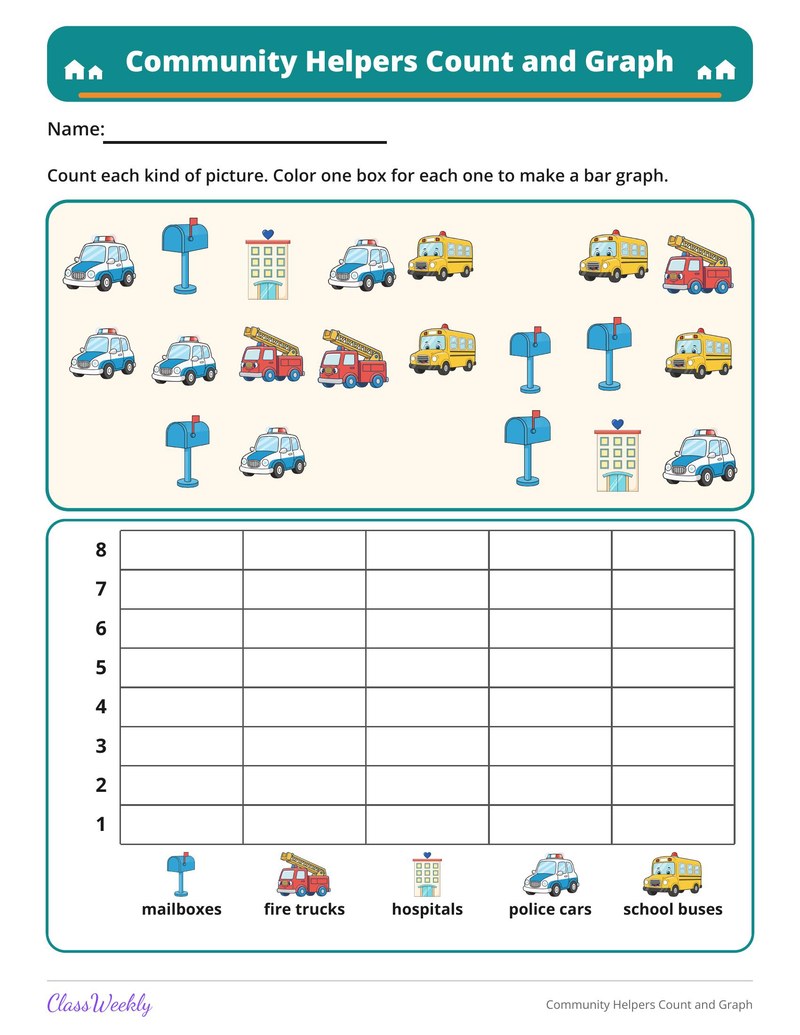
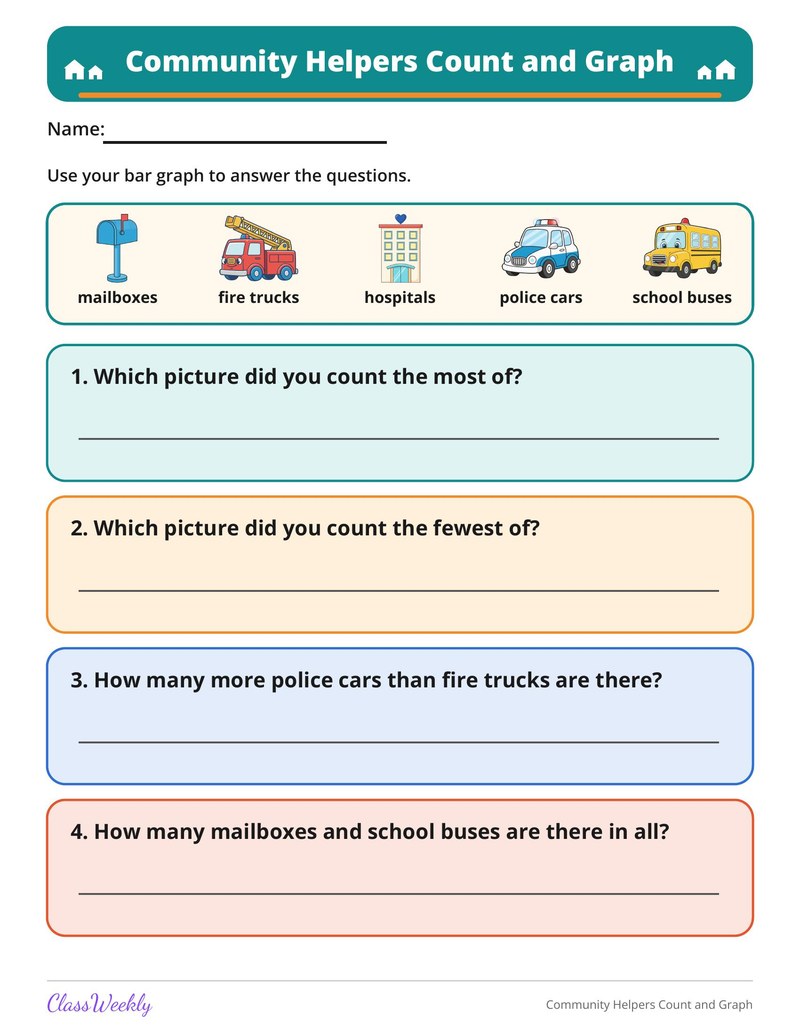
1st grade graphing worksheet: count 5 kinds of town pictures, color a bar graph, then answer 4 questions about it. Answer key included. Part of our bar graphs data & graphing collection. Aligned to Common Core standards.
How do I use this worksheet?
Print the page and read the directions with your child: Count each kind of picture. Color one box for each one to make a bar graph. When they finish, check the work together with the answer key.
What students will practice
- Students will count and record five groups of objects.
- Students will build a bar graph from their counts.
- Students will use the graph to compare and add amounts.


Curriculum Links
Common Core State Standards
Measurement and Data · 1st Grade
Standard: Organize, represent, and interpret data with up to three categories; ask and answer questions about the total number of data points, how many in each category, and how many more or less are in one category than in another.
View all 1.MD.C.4 worksheets →Find this in the curriculum
Browse the grade, subject, and topic this belongs to.
FAQ
How do I use this bar graphs worksheet?
⌄
Print the page and read the directions with your child: Count each kind of picture. Color one box for each one to make a bar graph. When they finish, check the work together with the answer key.
What does this worksheet teach?
⌄
Page 1 shows a mix of mailboxes, fire trucks, hospitals, police cars and school buses to count, with a bar graph from 1 to 8 below. Page 2 has four questions about the graph, such as "How many more police cars than fire trucks are there?" and "How many mailboxes and school buses are there in all?" The directions on the page read: Count each kind of picture. Color one box for each one to make a bar graph. An answer key is included.
Can I use this bar graphs worksheet for homeschool or classroom?
⌄
Yes, both. We made it for 1st Grade data & graphing, and the page works the same whether it lands on a kitchen table or a center rotation. At home, most families go through it together and talk the answers out loud, and that talking is where most of the learning happens with bar graphs. In class it runs well as independent work while you pull a small group. Print one copy or thirty, whichever the day needs.
What topics are used in 1st grade bar graph worksheets?
⌄
Common themes include favorite animals, sports, foods, and school activities - topics that feel relevant and engaging to young learners.
Should students be able to read a bar graph before they create one?
⌄
Reading comes first; once students can extract information from a graph, they are better prepared to understand how to construct one accurately.
How do bar graphs differ from pictographs in 1st grade instruction?
⌄
Bar graphs use a scaled axis to show quantities, while pictographs use pictures - bar graphs are slightly more abstract and introduce students to the idea of a numbered scale.
What data and graphing skills should first graders learn?
⌄
First graders should organize, represent, and interpret data with up to three categories (CCSS 1.MD.C.4). They create and read picture graphs and bar graphs, ask and answer questions about the total number in each category, how many more or fewer are in one category compared to another, and how many objects are represented altogether. This goes beyond kindergarten graphing by introducing comparison questions that require addition and subtraction. Students should also collect their own simple data through surveys or observations. Worksheets that present a completed graph and ask comparison questions like "How many more students chose dogs than cats?" build the interpretive thinking that transforms graphing from a visual exercise into genuine data analysis.
How do you teach first graders to read a bar graph?
⌄
Start by building a bar graph together as a class using real data, such as a survey of favorite ice cream flavors. Use a large chart paper with a grid where each student places a sticky note in the correct column. Then discuss what the graph shows: which flavor is most popular, which is least popular, and how many chose each flavor. Transfer this understanding to worksheets by pointing out the title, labels, and scale of a pre-made graph. Ask questions that require counting ("How many chose vanilla?"), comparing ("Which has the most?"), and calculating ("How many more chose chocolate than strawberry?"). Practicing with familiar topics keeps children engaged while building analytical skills.
Why is data analysis included in first grade math?
⌄
Data analysis develops critical thinking by teaching children to collect information, organize it, and draw conclusions. These skills apply well beyond math class. When first graders read a graph and determine that one category has more than another, they practice addition and subtraction in a meaningful context. Graphing also reinforces counting, comparison, and place value skills. The process of designing a survey question, collecting responses, and creating a graph teaches children that math can answer real questions about their world. Worksheets that guide students through the full data cycle, from collecting data to creating a graph to answering questions about it, provide structured practice in this important area of mathematical reasoning.
What is on these 1st grade data and graphing worksheets?
⌄
Tally pages count, draw and compare marks to 20, tally two weeks of sunny, cloudy and rainy days and make a tally chart of pets. Picture graph pages read fruit picked and pond animals and build graphs from a tally chart. Bar graph pages read recess games and ice pop flavors and color graphs of instruments and vegetables. Questions ask how many, how many more or fewer and how many in all, and every sheet has an answer key.
Ratings & Reviews
No reviews yet. Be the first to share what you think.
Reviews are for ClassWeekly members.
Make a Request
Spotted something to fix, or want a worksheet we don't have yet? Tell us and we'll make it.
Worksheet Details
| Grade | 1st Grade |
| Subject | Math |
| Topic | Data & Graphing |
| Standard | 1.MD.C.4 |
| Pages | 2 pages |
| Difficulty | Medium |
Learn More
What is ClassWeekly?
ClassWeekly offers free worksheets and printable learning resources for kids, from preschool up. All worksheets are aligned to Common Core, NGSS, and C3 Framework standards and designed by educators. Become a member to access the full library and download unlimited PDFs.