Compare Spread Using Range and Signed Data
Written by Adi Ackerman, Head Teacher
"Compare Spread Using Range and Signed Data" is written for 7th Grade (Ages 12-13), and it covers Common Core 7.SP.B.4. A 6th grader who is already steady on data & graphing can use it too, and an older student can use it as a short review.
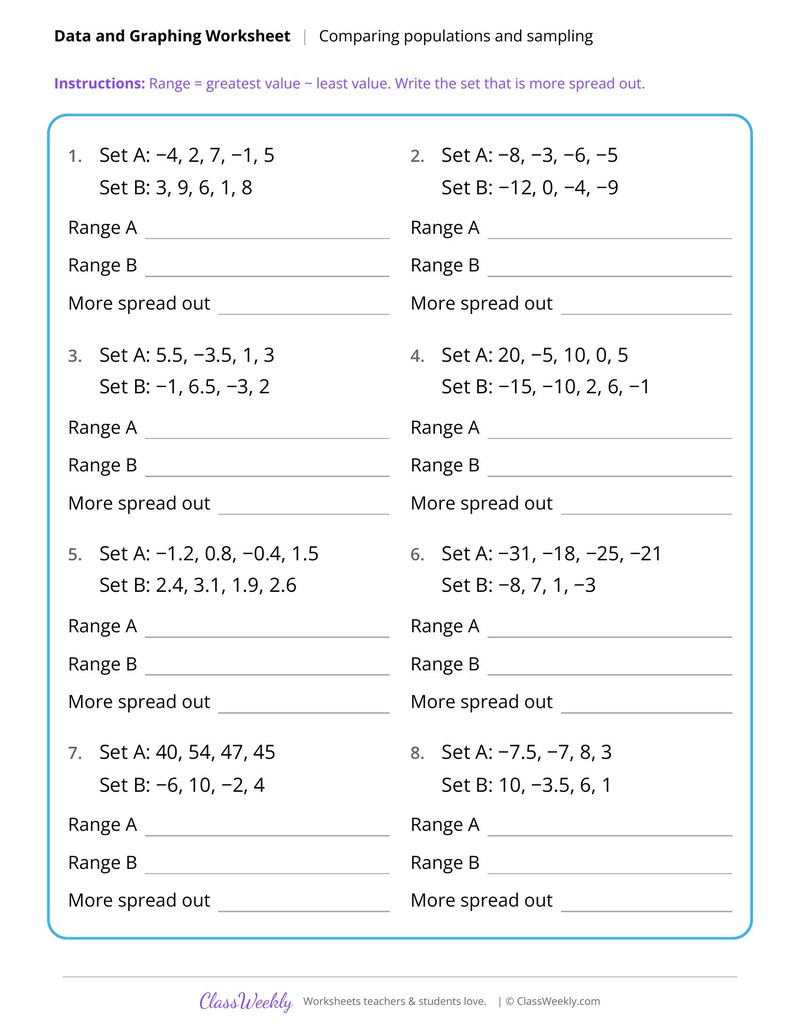
7th grade math worksheet: find the range of two sets with negative values and decide which set is more spread out. Answer key included. Part of our comparing populations and sampling data & graphing collection. Aligned to Common Core standards.
How do I use this worksheet?
Use the center and range sheets first, then the comparison sheets. The claims sheet works well for discussion.
What students will practice
- Students will find the range as greatest value minus least value.
- Students will subtract with negative numbers and decimals.
- Students will decide which of two sets is more spread out.
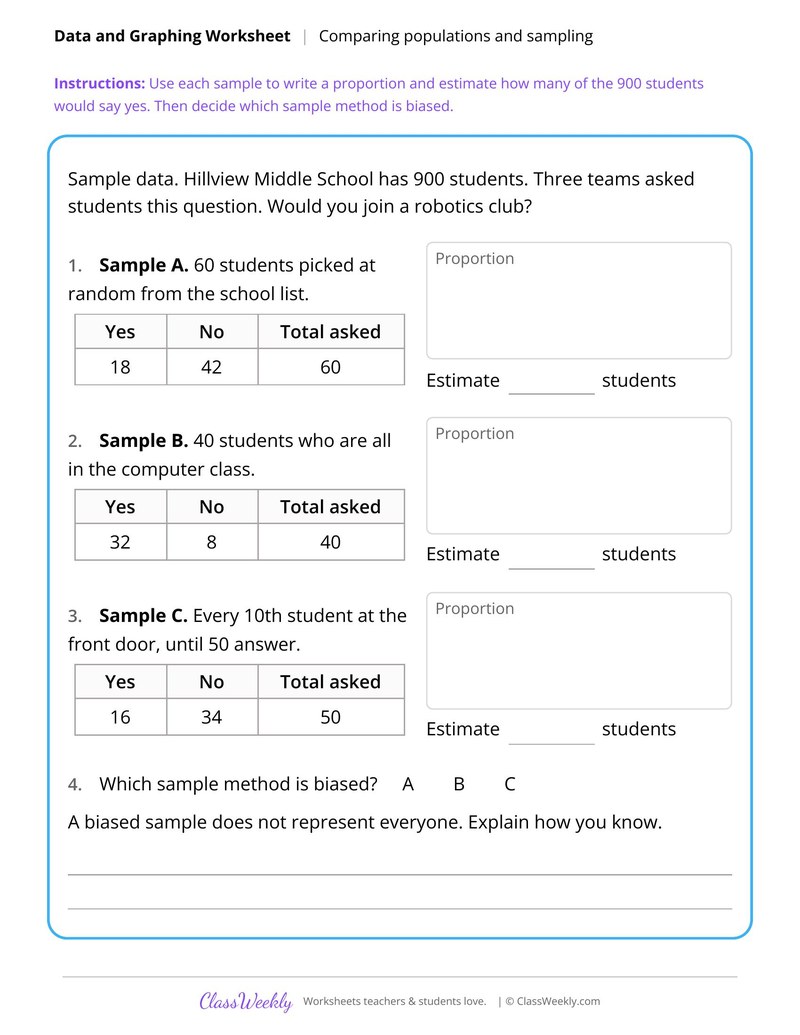
Draw Inferences From Random Samples
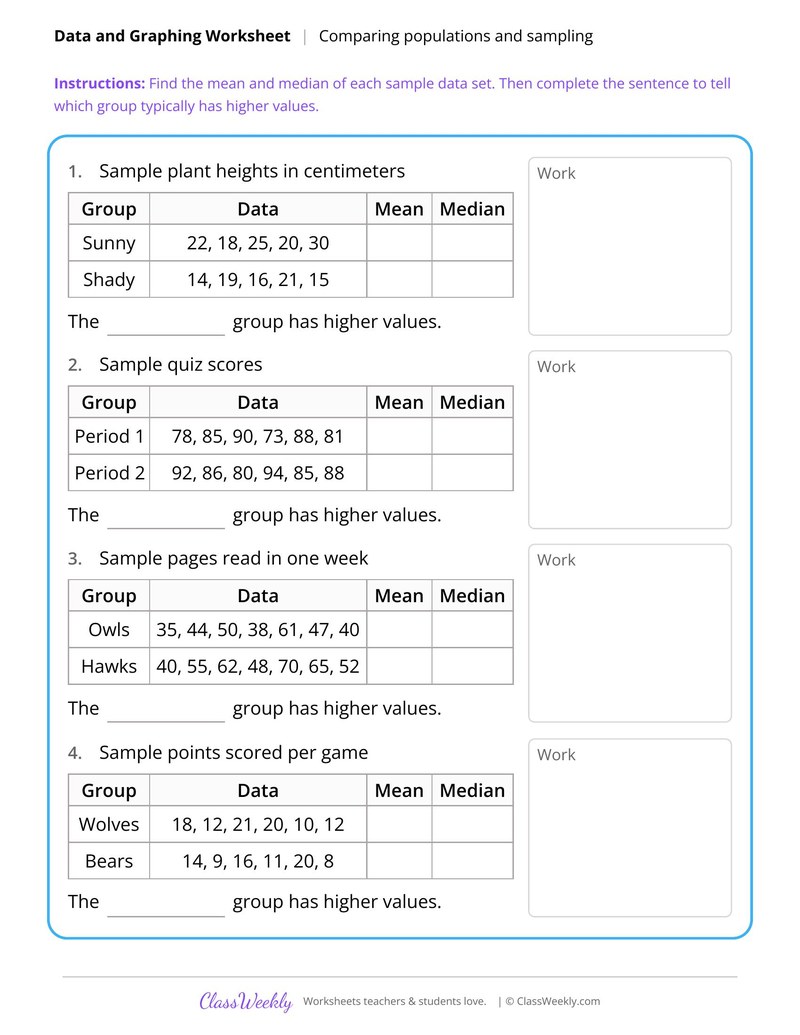
Compare Two Populations With Measures of Center
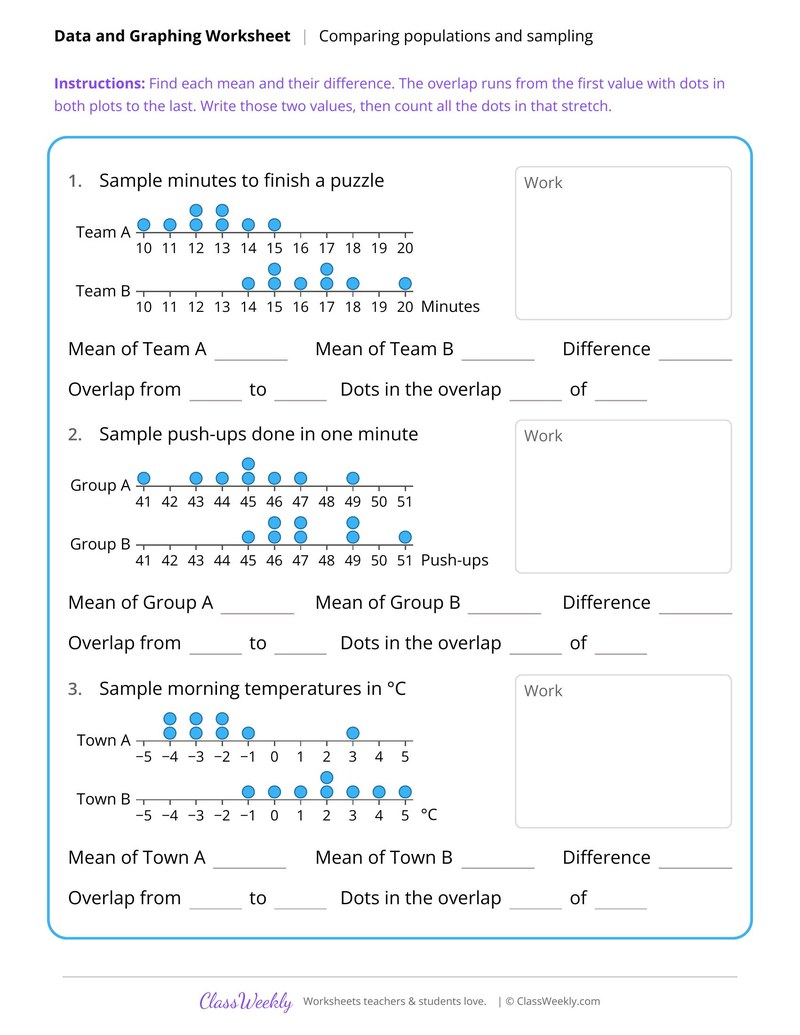
Compare Two Dot Plots and Their Overlap
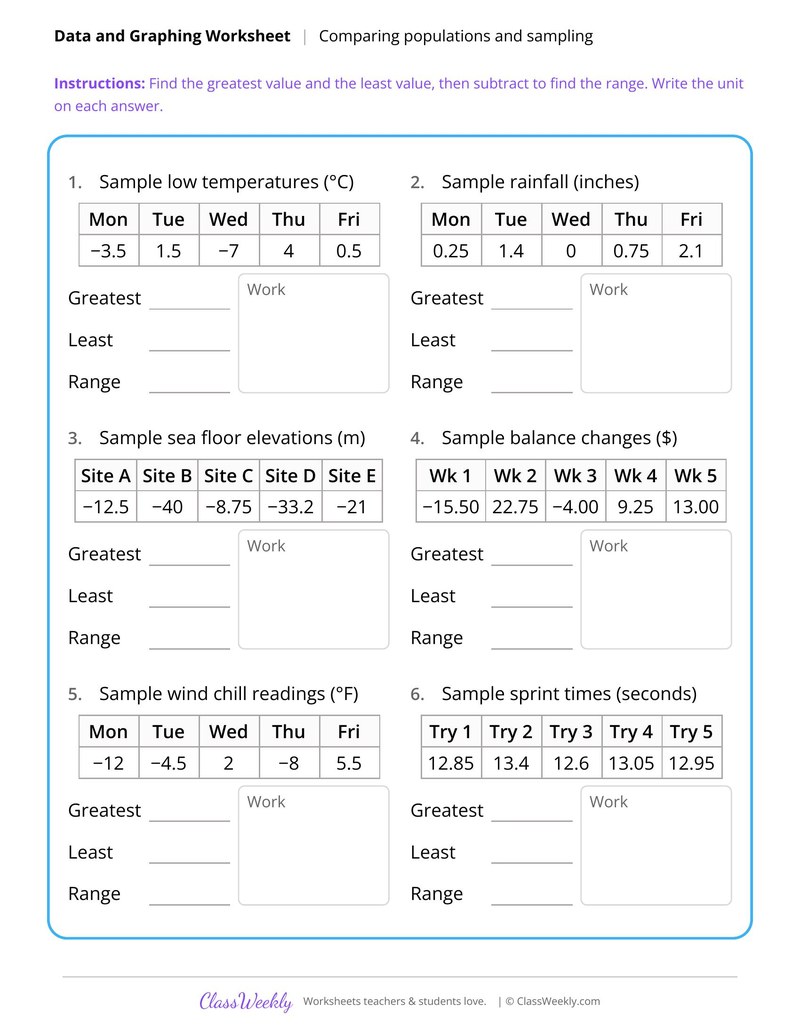
Find the Range in Real-World Data Tables
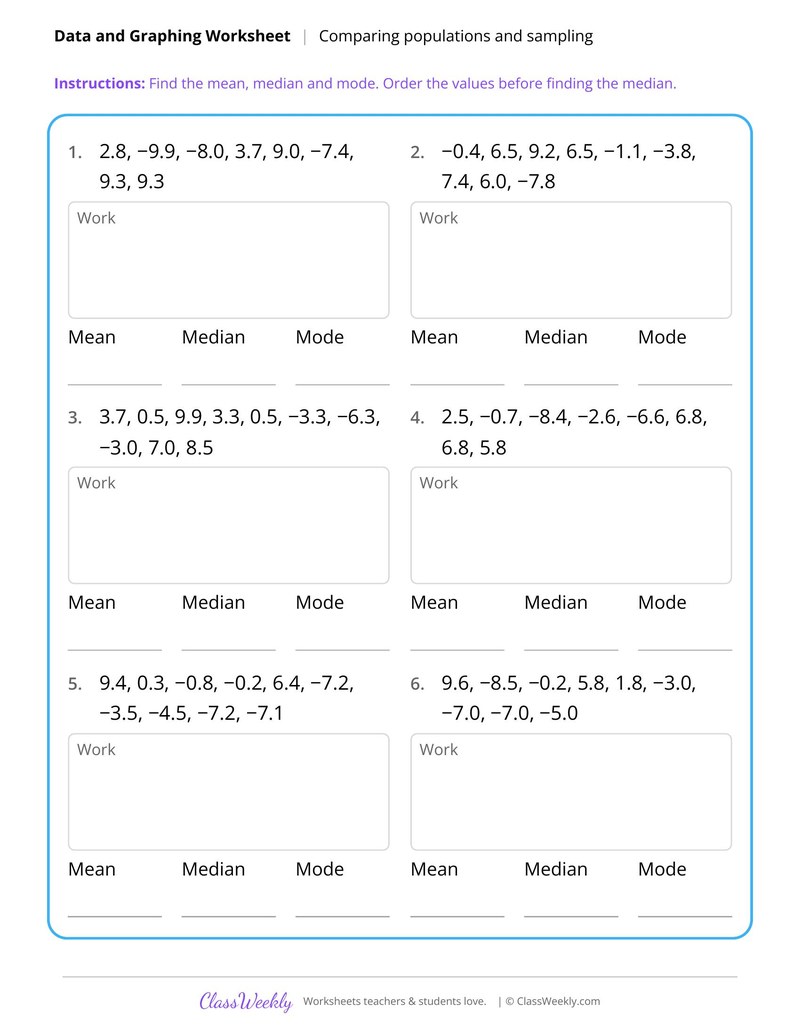
Mean, Median and Mode With Signed Decimals
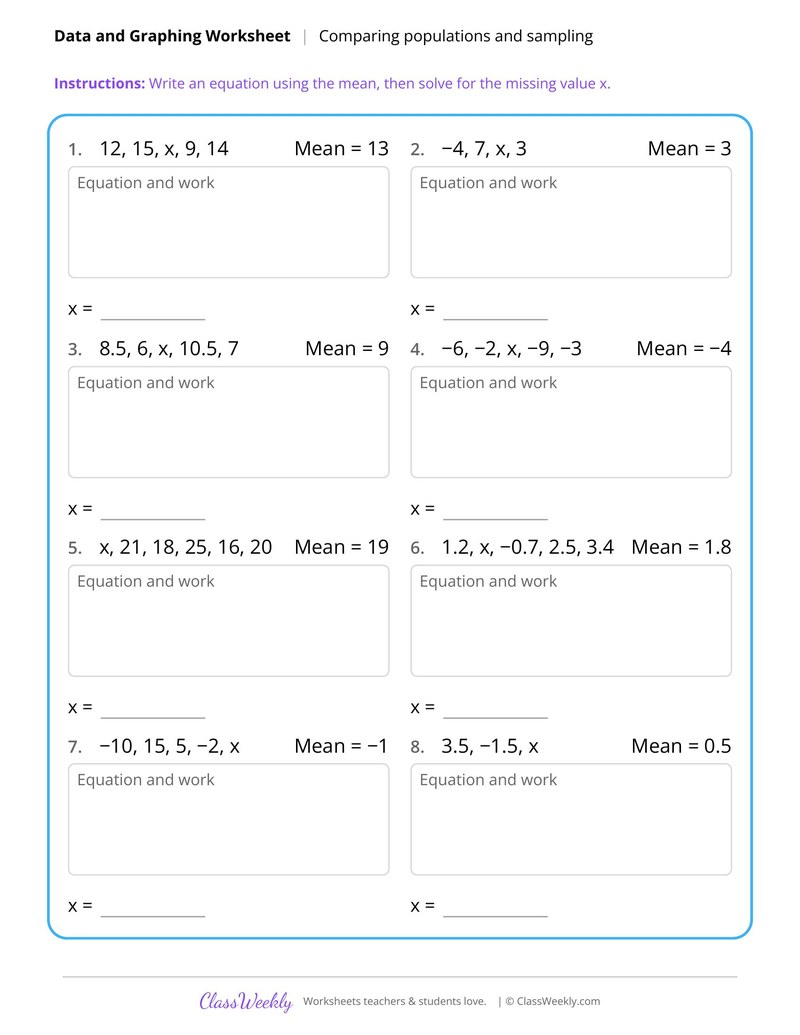
Find a Missing Value From a Target Mean
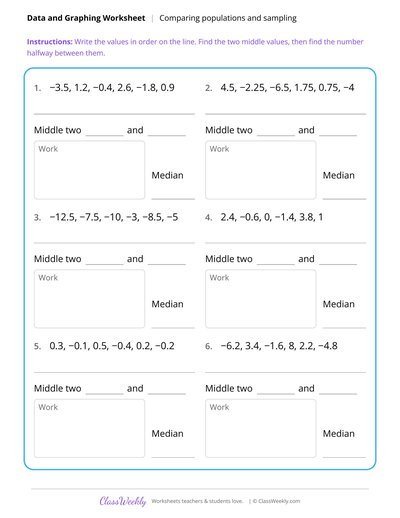
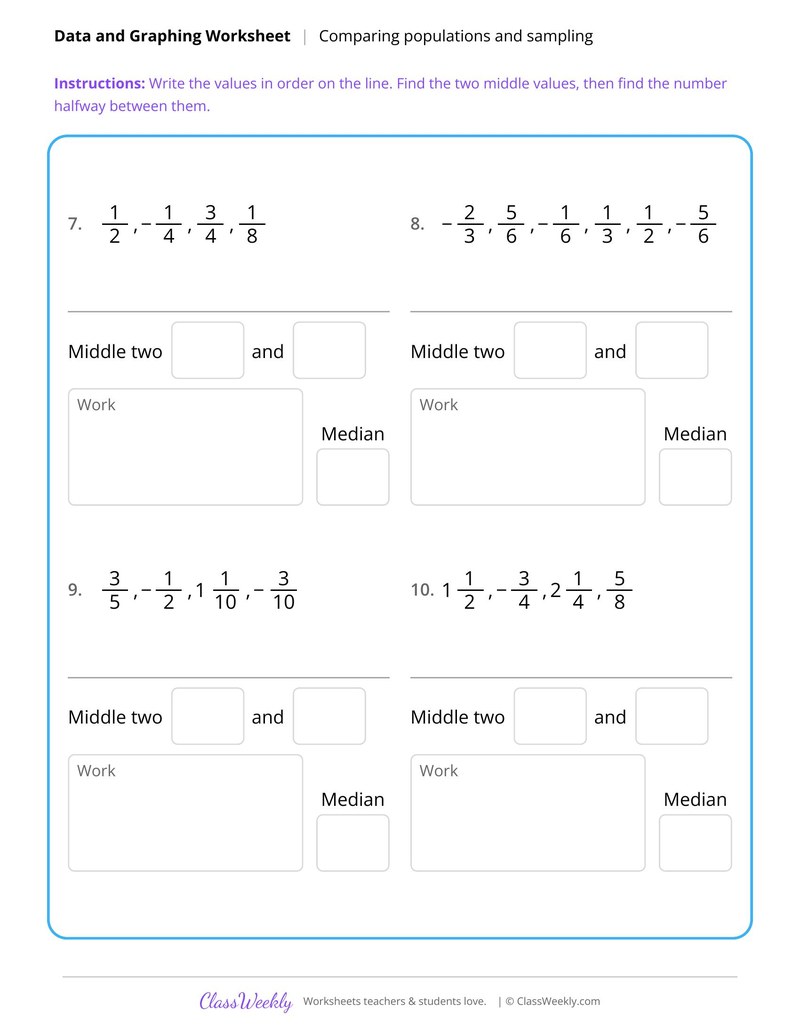
Median of Even-Sized Sets With Rational Values
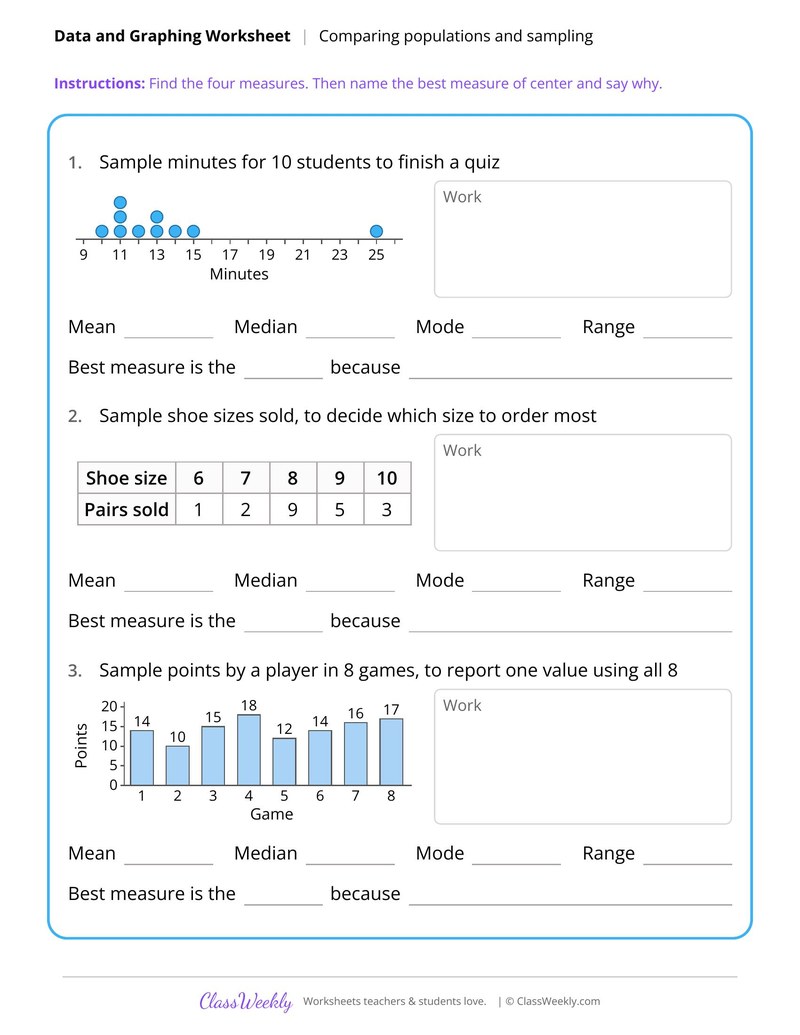
Describe Data Using Center and Spread
Curriculum Links
Common Core State Standards
Statistics and Probability · 7th Grade
Standard: Use measures of center and measures of variability for numerical data from random samples to draw informal comparative inferences about two populations.
View all 7.SP.B.4 worksheets →Find this in the curriculum
Browse the grade, subject, and topic this belongs to.
FAQ
How do I use this comparing populations and sampling worksheet?
⌄
Use the center and range sheets first, then the comparison sheets. The claims sheet works well for discussion.
What does this worksheet teach?
⌄
Find the range of two sets with negative values and decide which set is more spread out. The directions on the page read: Range = greatest value − least value. Write the set that is more spread out. An answer key is included.
Can I use this comparing populations and sampling worksheet for homeschool or classroom?
⌄
Yes, both. We made it for 7th grade data & graphing, and it works the same at home or at school. At home, a student can work through it alone and then go over it with you, which shows quickly what is solid and what needs another look. In class it works as independent practice, homework or a warm-up, and you can print one copy or a full set.
How do you compare two groups using data?
⌄
Find a measure of center such as mean or median for each group, then compare them. Add a measure of spread such as the range to describe variation.
How do you find a missing value from a mean?
⌄
Write an equation with the sum of the values divided by their count equal to the mean, then solve for x. The Find a Missing Value From a Target Mean worksheet does this.
How do you find the median of an even-sized set?
⌄
Put the values in order, then find the number halfway between the two middle values. The Median of Even-Sized Sets worksheet uses rational values.
Do these worksheets have answer keys?
⌄
Yes. All 11 worksheets in this group have answer keys.
Ratings & Reviews
No reviews yet. Be the first to share what you think.
Reviews are for ClassWeekly members.
Make a Request
Spotted something to fix, or want a worksheet we don't have yet? Tell us and we'll make it.
Worksheet Details
| Grade | 7th Grade |
| Subject | Math |
| Topic | Data & Graphing |
| Standard | 7.SP.B.4 |
| Pages | 1 page |
| Difficulty | Medium |
Learn More
What is ClassWeekly?
ClassWeekly offers free worksheets and printable learning resources for kids, from preschool up. All worksheets are aligned to Common Core, NGSS, and C3 Framework standards and designed by educators. Become a member to access the full library and download unlimited PDFs.
Draw Inferences From Random Samples
Compare Two Populations With Measures of Center
Compare Two Dot Plots and Their Overlap
Find the Range in Real-World Data Tables
Mean, Median and Mode With Signed Decimals
Find a Missing Value From a Target Mean
Median of Even-Sized Sets With Rational Values
Describe Data Using Center and Spread