Make a Box Plot From Data
Written by Adi Ackerman, Head Teacher
"Make a Box Plot From Data" is written for 6th Grade (Ages 11-12), and it covers Common Core 6.SP.B.4. If your student is a year younger but already steady on data & graphing, the page still works. You may just need to read the instructions out loud. And if they are older and box plots and interquartile range never quite stuck, this is a short review rather than busywork.
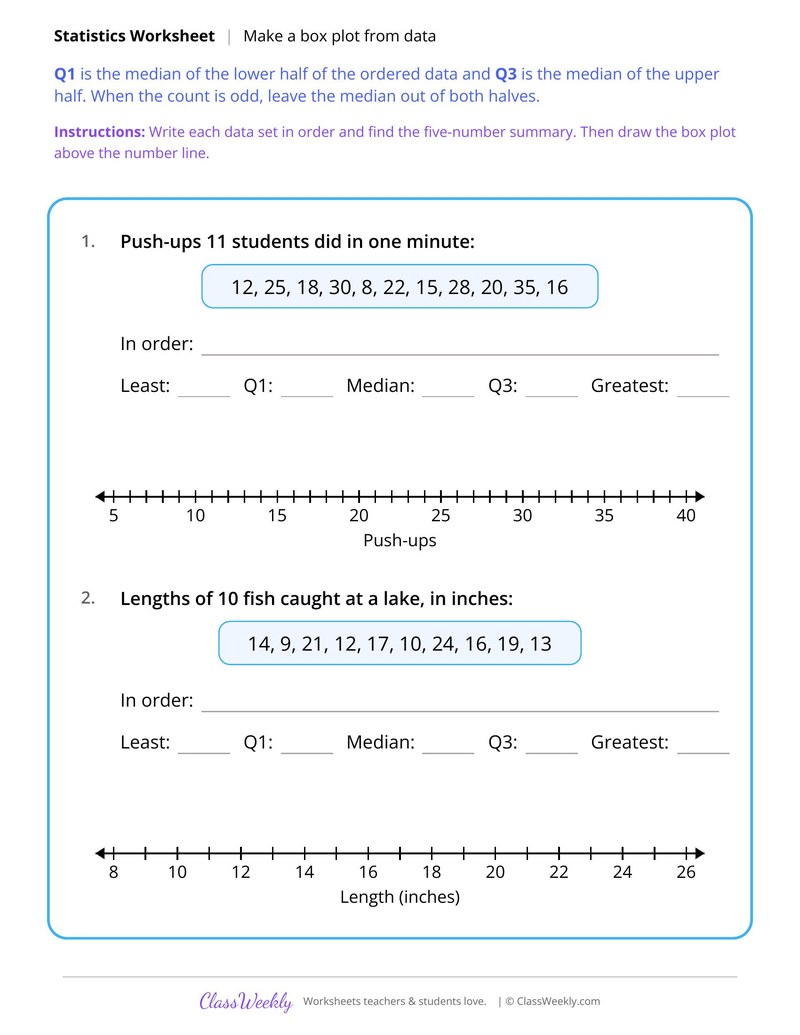
6th grade math worksheet: find five-number summaries and draw box plots for push-ups and the lengths of 10 fish. Answer key included. Part of our box plots and interquartile range data & graphing collection. Aligned to Common Core standards.
How do I use this worksheet?
Begin with reading box plots so students know the five numbers. Then find quartiles and the IQR, and finish by drawing box plots.
What students will practice
- Students will order 2 data sets and find the least, Q1, median, Q3 and greatest values.
- Students will find a median of 15 inches from an even count of fish lengths.
- Students will draw each box plot above a scaled number line.
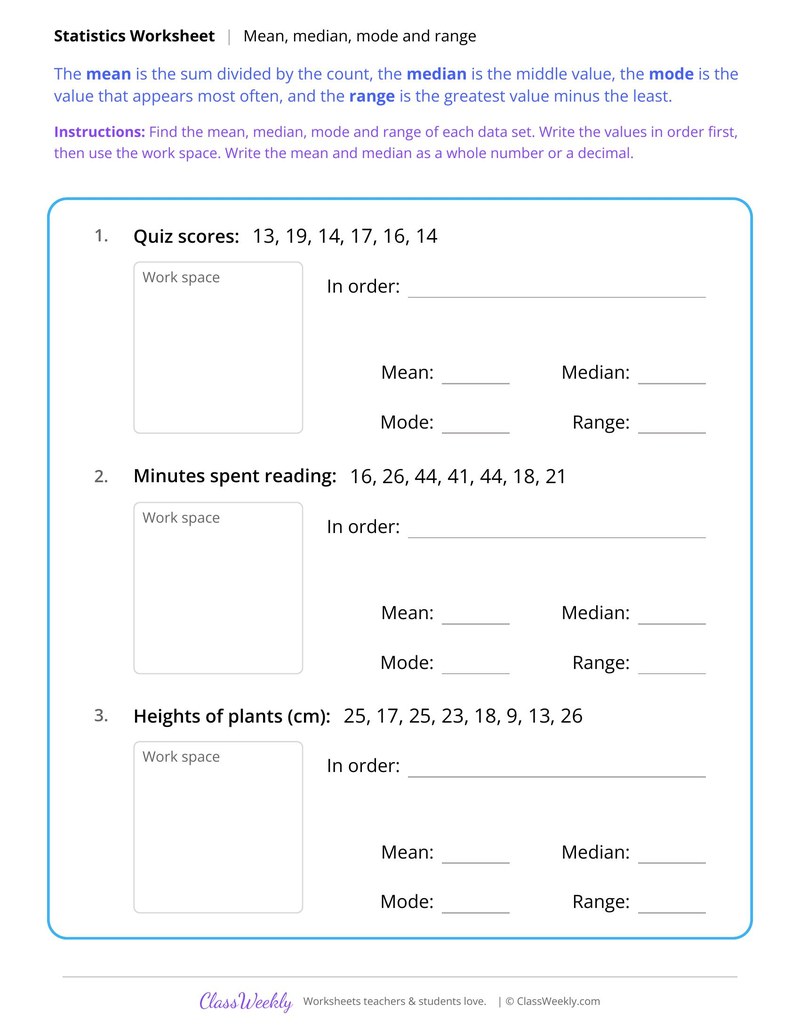
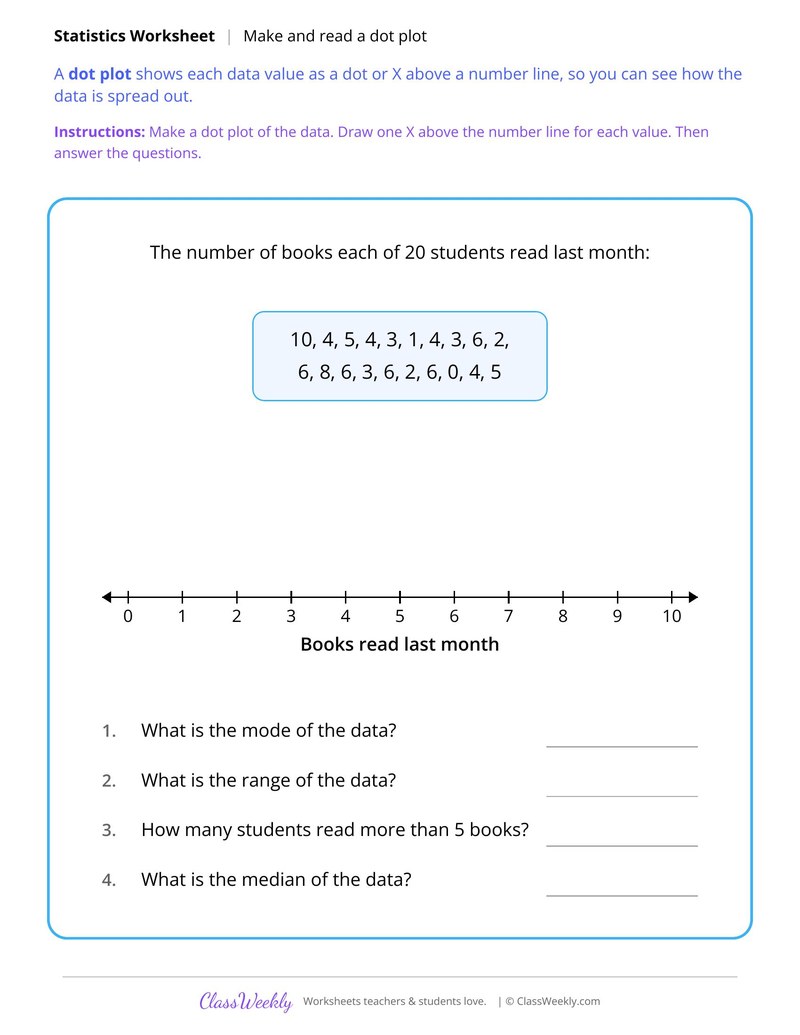
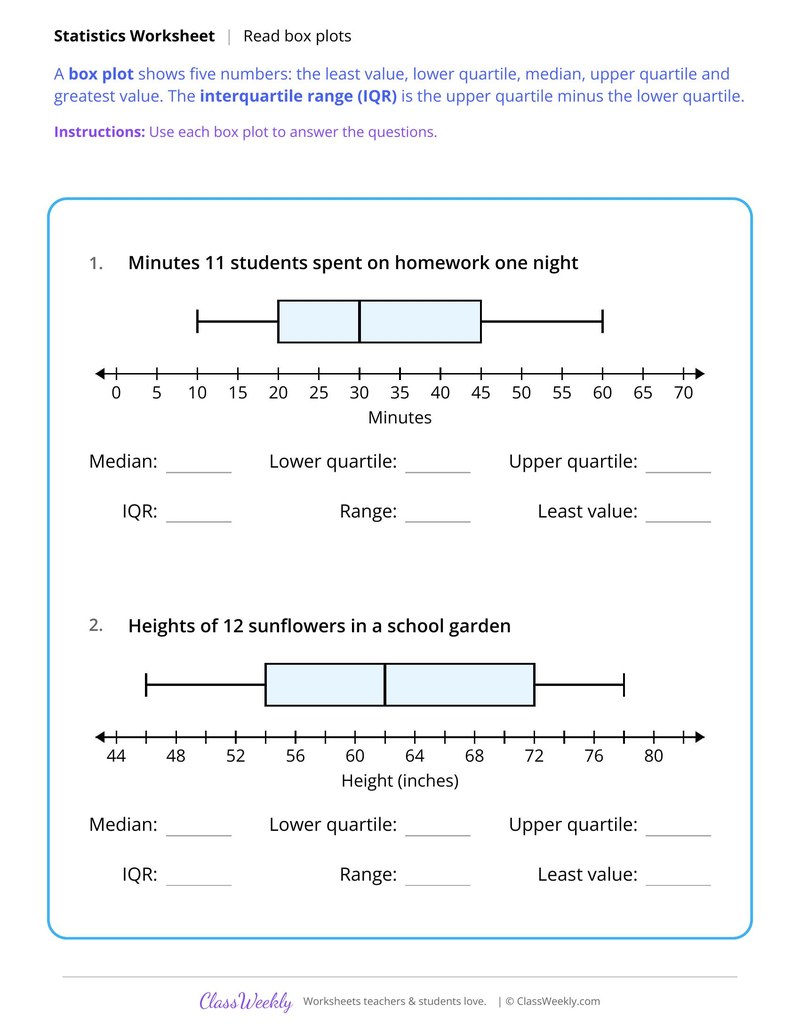
Curriculum Links
Common Core State Standards
Statistics and Probability · 6th Grade
Standard: Display numerical data in plots on a number line, including dot plots, histograms, and box plots.
View all 6.SP.B.4 worksheets →Find this in the curriculum
Browse the grade, subject, and topic this belongs to.
FAQ
How do I use this box plots and interquartile range worksheet?
⌄
Begin with reading box plots so students know the five numbers. Then find quartiles and the IQR, and finish by drawing box plots.
What does this worksheet teach?
⌄
Find five-number summaries and draw box plots for push-ups and the lengths of 10 fish. Q1 is the median of the lower half of the ordered data and Q3 is the median of the upper half. When the count is odd, leave the median out of both halves. The directions on the page read: Write each data set in order and find the five-number summary. Then draw the box plot above the number line. An answer key is included.
Can I use this box plots and interquartile range worksheet for homeschool or classroom?
⌄
Yes, both. We made it for 6th Grade data & graphing, and the page works the same whether it lands on a kitchen table or a center rotation. At home, most families go through it together and talk the answers out loud, and that talking is where most of the learning happens with box plots and interquartile range. In class it runs well as independent work while you pull a small group. Print one copy or thirty, whichever the day needs.
How do you find Q1 and Q3?
⌄
Order the data and find the median. Q1 is the median of the lower half and Q3 is the median of the upper half. When the count is odd, leave the median out of both halves.
What does the interquartile range show?
⌄
The IQR is the spread of the middle half of the data. For homework minutes with a lower quartile of 20 and an upper quartile of 45, the IQR is 25 minutes.
How do you draw a box plot?
⌄
Find the five-number summary, mark the five values above a number line, draw a box from Q1 to Q3 with a line at the median, and draw whiskers to the least and greatest values.
Is there an answer key?
⌄
Yes. All 3 box plot worksheets have an answer key.
Ratings & Reviews
No reviews yet. Be the first to share what you think.
Reviews are for ClassWeekly members.
Make a Request
Spotted something to fix, or want a worksheet we don't have yet? Tell us and we'll make it.
Worksheet Details
| Grade | 6th Grade |
| Subject | Math |
| Topic | Data & Graphing |
| Standard | 6.SP.B.4 |
| Pages | 1 page |
| Difficulty | Medium |
Learn More
What is ClassWeekly?
ClassWeekly offers free worksheets and printable learning resources for kids, from preschool up. All worksheets are aligned to Common Core, NGSS, and C3 Framework standards and designed by educators. Become a member to access the full library and download unlimited PDFs.