Make a Histogram From a Frequency Table
Written by Adi Ackerman, Head Teacher
"Make a Histogram From a Frequency Table" is written for 6th Grade (Ages 11-12), and it covers Common Core 6.SP.B.4. If your student is a year younger but already steady on data & graphing, the page still works. You may just need to read the instructions out loud. And if they are older and dot plots and histograms never quite stuck, this is a short review rather than busywork.
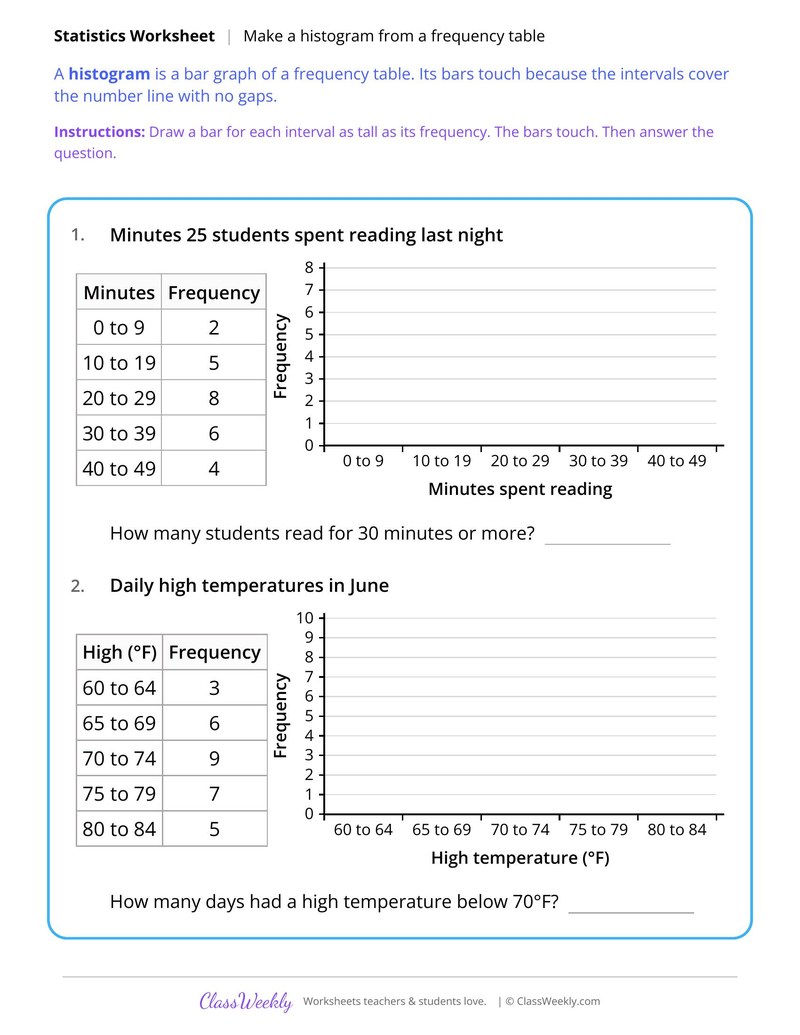
6th grade math worksheet: draw 2 histograms from frequency tables of reading minutes and daily high temperatures. Answer key included. Part of our dot plots and histograms data & graphing collection. Aligned to Common Core standards.
How do I use this worksheet?
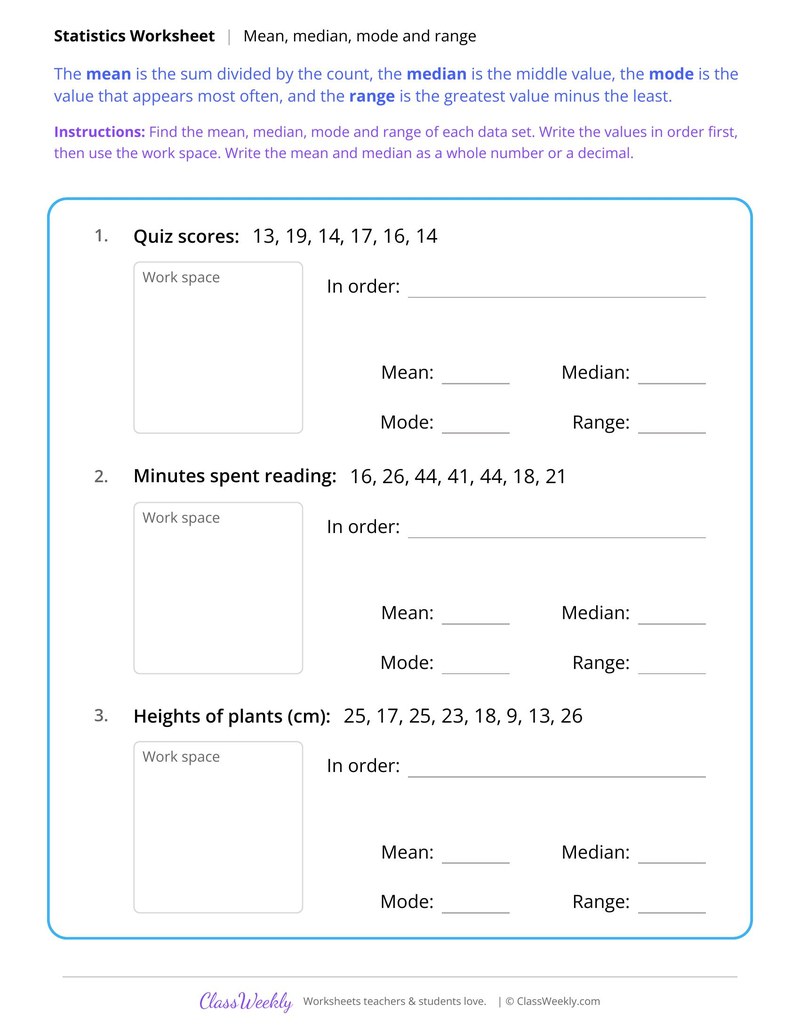
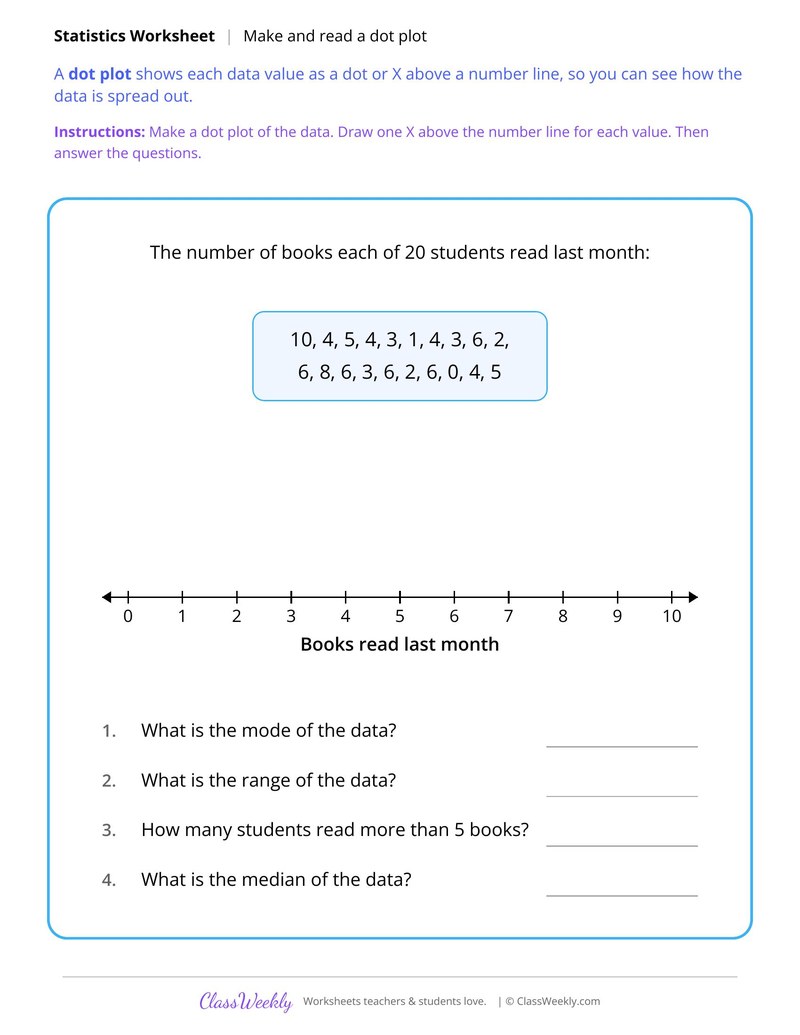
Start with the dot plot page, then the frequency table and histogram pages in order. Use the shape page last to discuss symmetric and skewed data.
What students will practice
- Students will draw touching bars as tall as each frequency for 2 frequency tables.
- Students will label intervals like 0 to 9 minutes and 70 to 74 degrees Fahrenheit.
- Students will use each histogram to count, such as students who read 30 minutes or more.
Curriculum Links
Common Core State Standards
Statistics and Probability · 6th Grade
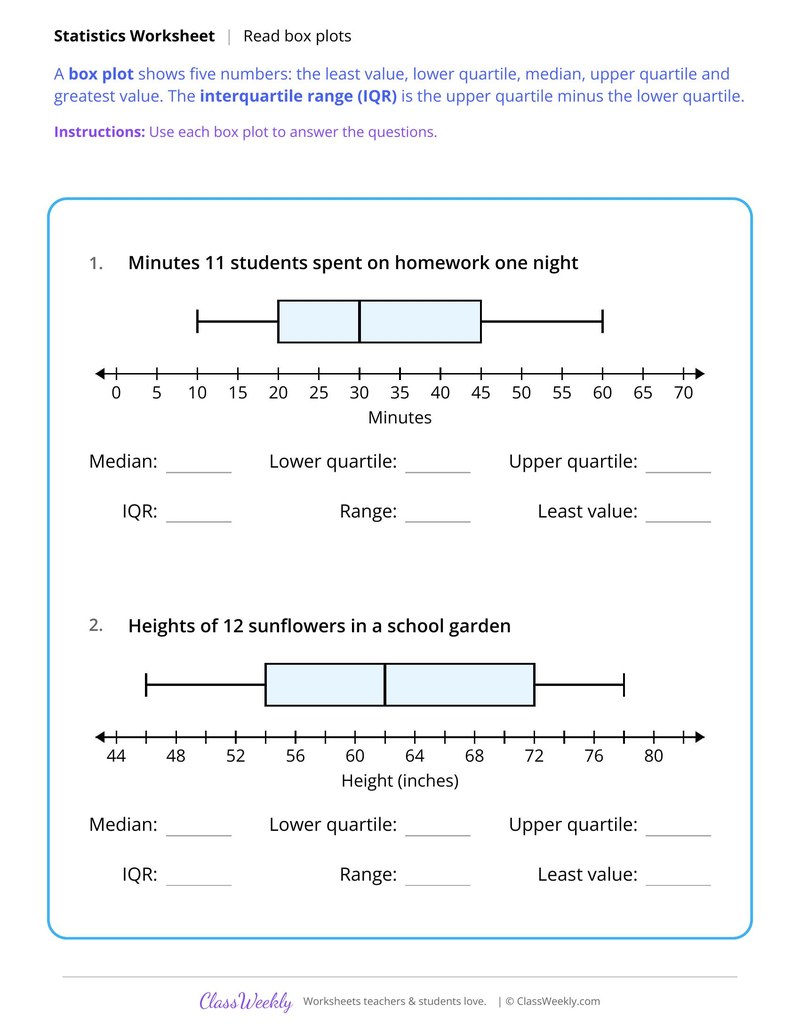
Standard: Display numerical data in plots on a number line, including dot plots, histograms, and box plots.
View all 6.SP.B.4 worksheets →Find this in the curriculum
Browse the grade, subject, and topic this belongs to.
FAQ
How do I use this dot plots and histograms worksheet?
⌄
Start with the dot plot page, then the frequency table and histogram pages in order. Use the shape page last to discuss symmetric and skewed data.
What does this worksheet teach?
⌄
Draw 2 histograms from frequency tables of reading minutes and daily high temperatures. A histogram is a bar graph of a frequency table. Its bars touch because the intervals cover the number line with no gaps. The directions on the page read: Draw a bar for each interval as tall as its frequency. The bars touch. Then answer the question. An answer key is included.
Can I use this dot plots and histograms worksheet for homeschool or classroom?
⌄
Yes, both. We made it for 6th Grade data & graphing, and the page works the same whether it lands on a kitchen table or a center rotation. At home, most families go through it together and talk the answers out loud, and that talking is where most of the learning happens with dot plots and histograms. In class it runs well as independent work while you pull a small group. Print one copy or thirty, whichever the day needs.
What is the difference between a dot plot and a histogram?
⌄
A dot plot shows every single value as a dot. A histogram groups values into intervals, such as 20 to 29, and shows the count for each interval as a bar.
Why do the bars in a histogram touch?
⌄
The intervals cover the number line with no gaps, such as 0 to 9, 10 to 19 and 20 to 29, so the bars sit side by side.
What does skewed mean?
⌄
A data display is skewed when most values pile up on one side and a tail stretches to the other. Scores on a 15-point quiz that cluster high with a few low scores are skewed left.
Is there an answer key?
⌄
Yes. All 5 worksheets have an answer key, including the finished dot plot and histograms.
Ratings & Reviews
No reviews yet. Be the first to share what you think.
Reviews are for ClassWeekly members.
Make a Request
Spotted something to fix, or want a worksheet we don't have yet? Tell us and we'll make it.
Worksheet Details
| Grade | 6th Grade |
| Subject | Math |
| Topic | Data & Graphing |
| Standard | 6.SP.B.4 |
| Pages | 1 page |
| Difficulty | Medium |
Learn More
What is ClassWeekly?
ClassWeekly offers free worksheets and printable learning resources for kids, from preschool up. All worksheets are aligned to Common Core, NGSS, and C3 Framework standards and designed by educators. Become a member to access the full library and download unlimited PDFs.