Use a Linear Model to Make Predictions
Written by Adi Ackerman, Head Teacher
"Use a Linear Model to Make Predictions" is written for 8th Grade (Ages 13-14), and it covers Common Core 8.SP.A.3. A 7th grader who is already steady on data & graphing can use it too, and an older student can use it as a short review.
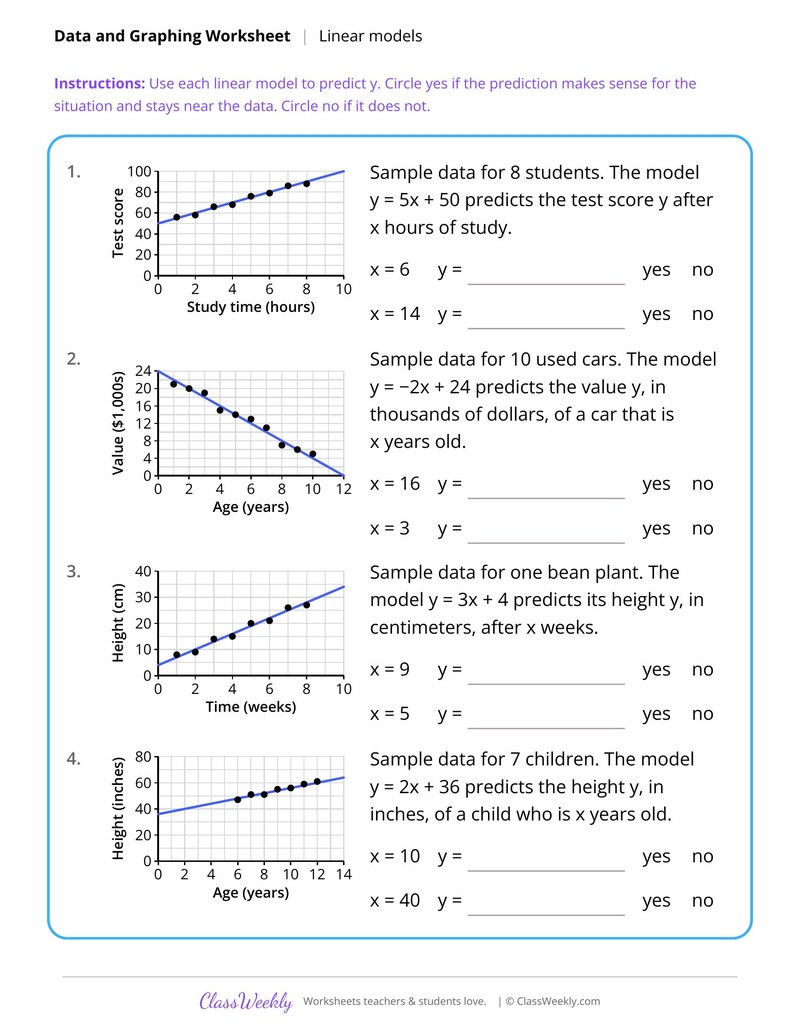
8th grade math worksheet: predict y from models like y = 5x + 50 and decide if each prediction makes sense near the data. Answer key included. Part of our linear models data & graphing collection. Aligned to Common Core standards.
How do I use this worksheet?
Use these after scatter plots and lines of best fit. Start with interpreting slope and intercept, then predictions, then writing models.
What students will practice
- Students will substitute x values into a linear model to predict y.
- Students will judge whether a prediction stays near the sample data.
- Students will decide if predictions such as a used car's value make sense.
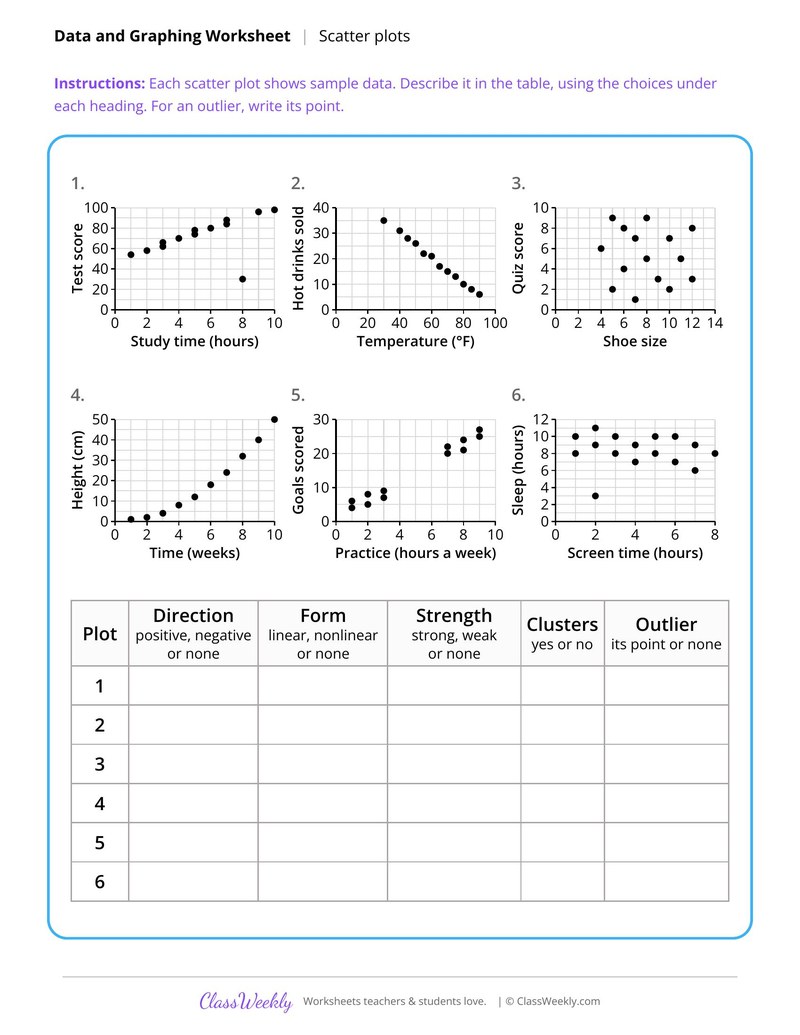
Describe Association in Scatter Plots
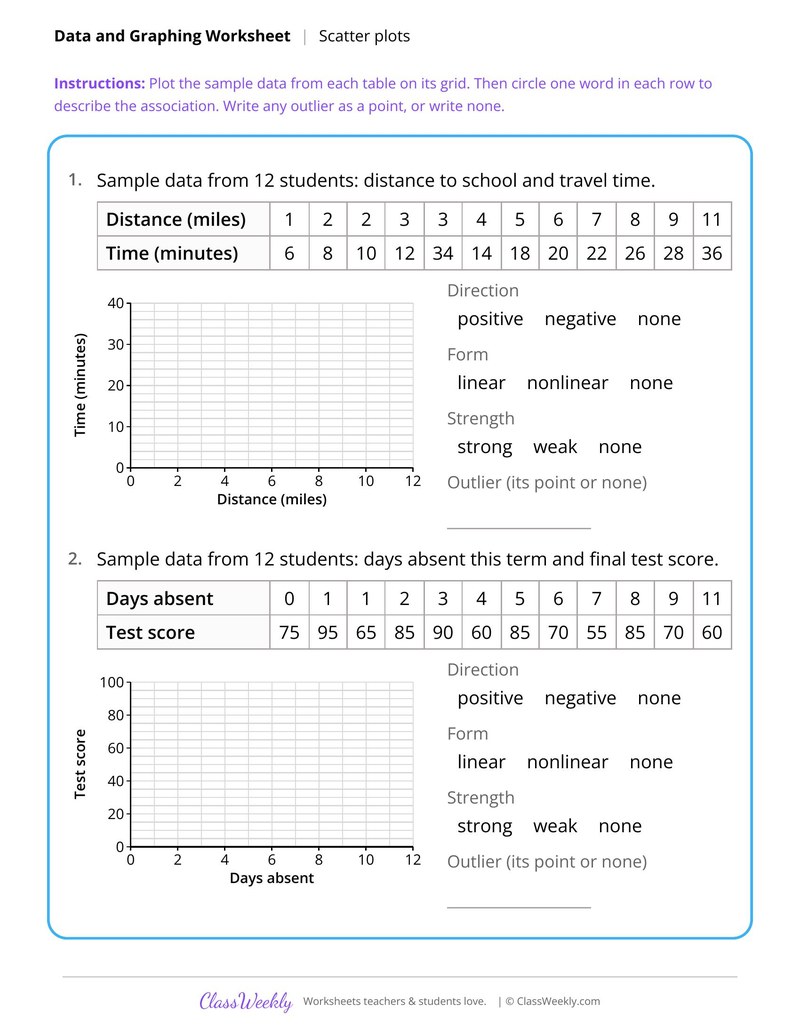
Construct Scatter Plots From Data Tables
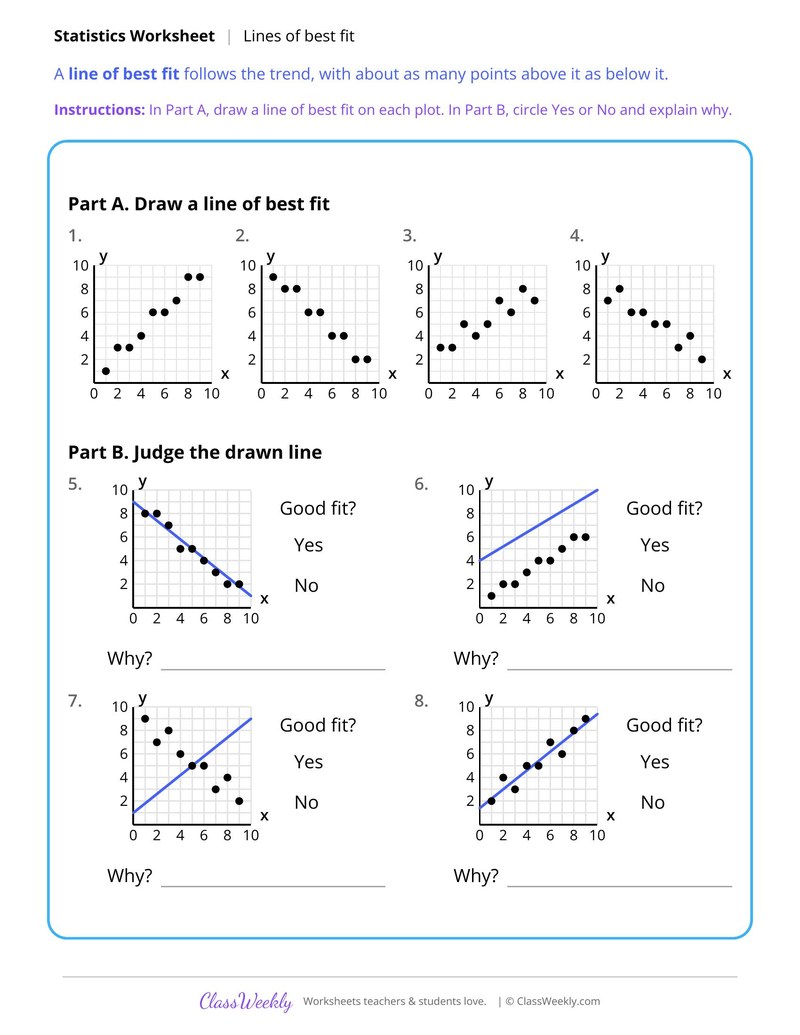
Draw and Judge Lines of Best Fit
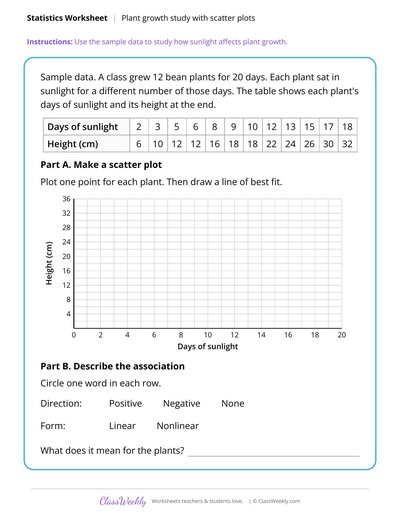
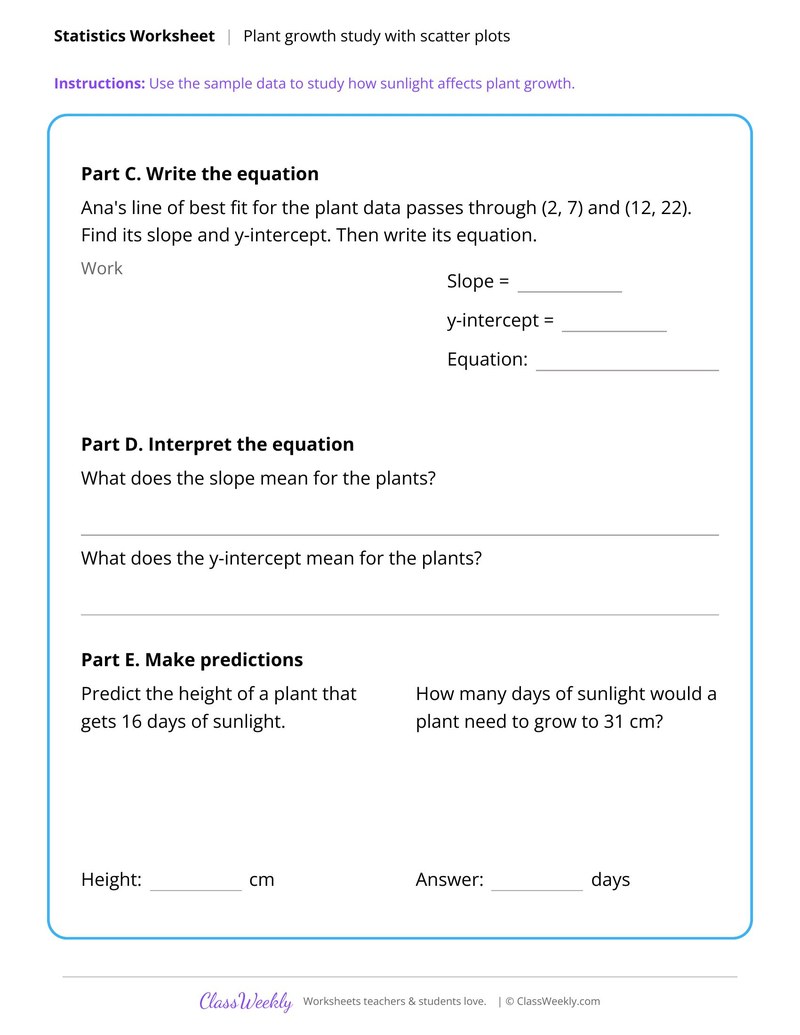
Plant Growth Study With Scatter Plots
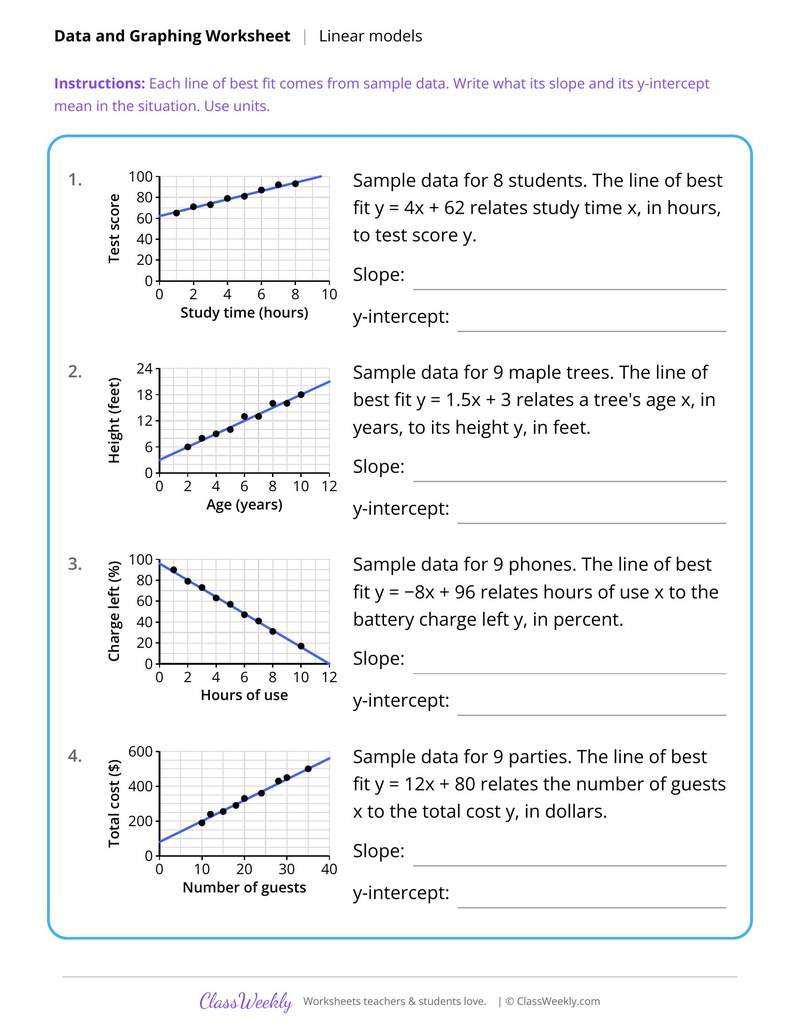
Interpret Slope and Intercept of a Line of Best Fit
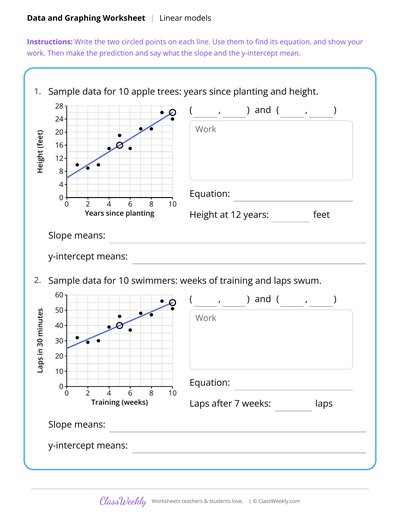
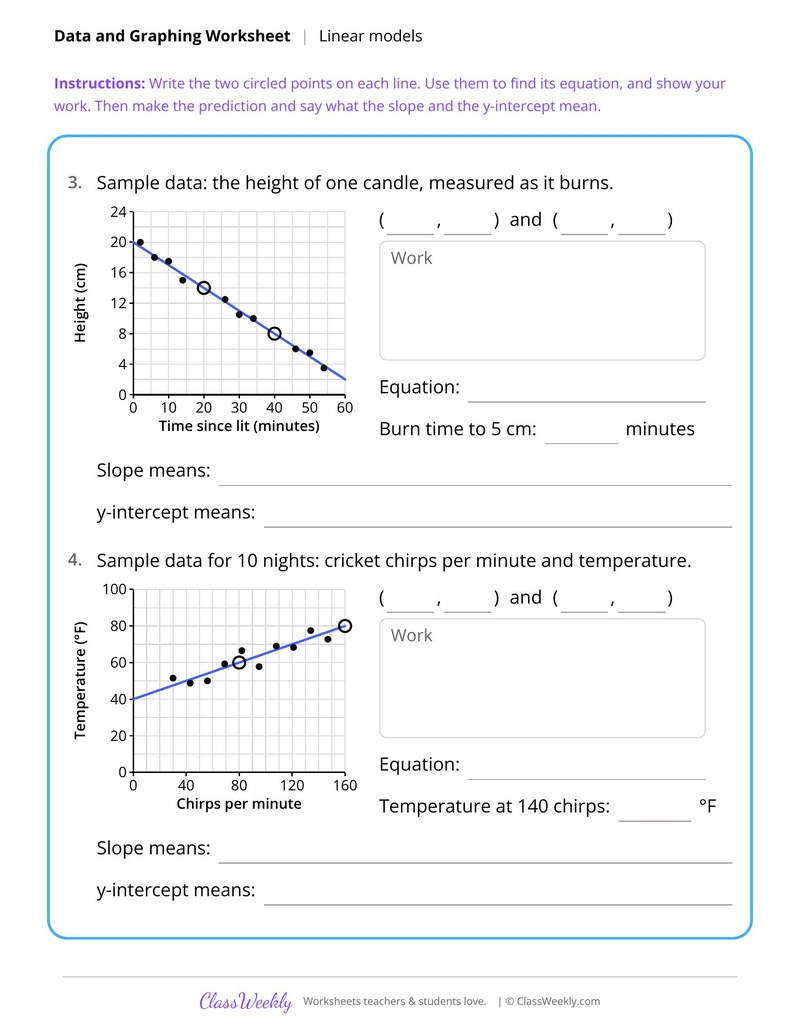
Write a Linear Model From a Scatter Plot
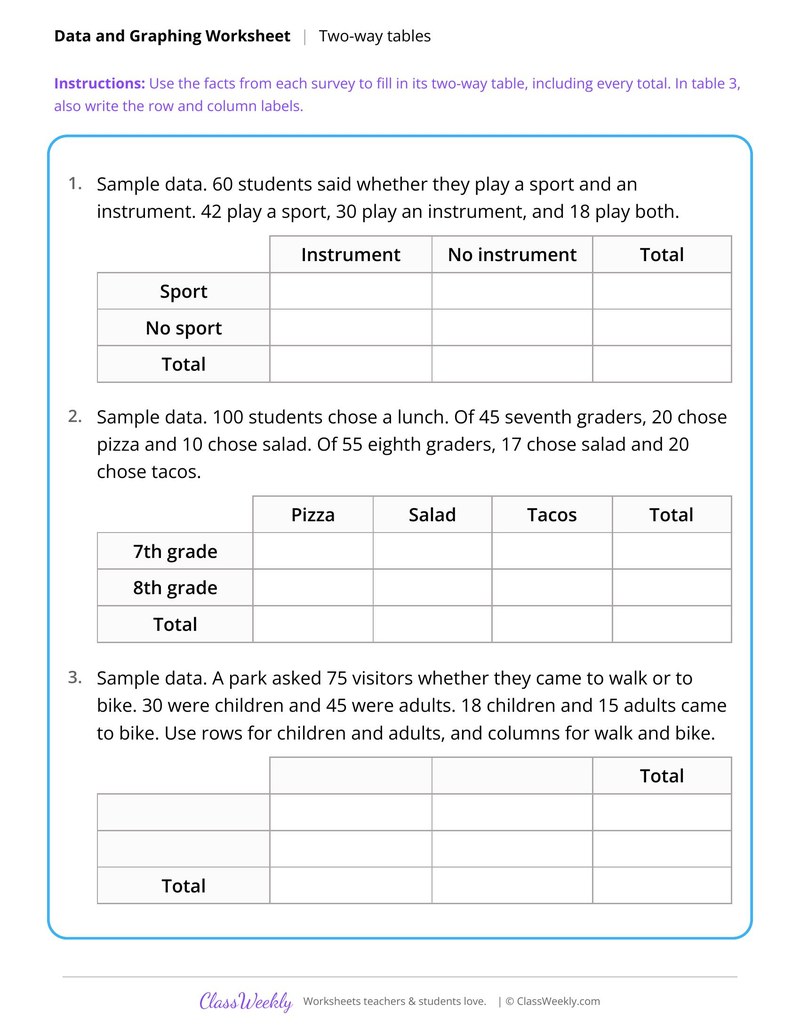
Build Two-Way Frequency Tables From Surveys
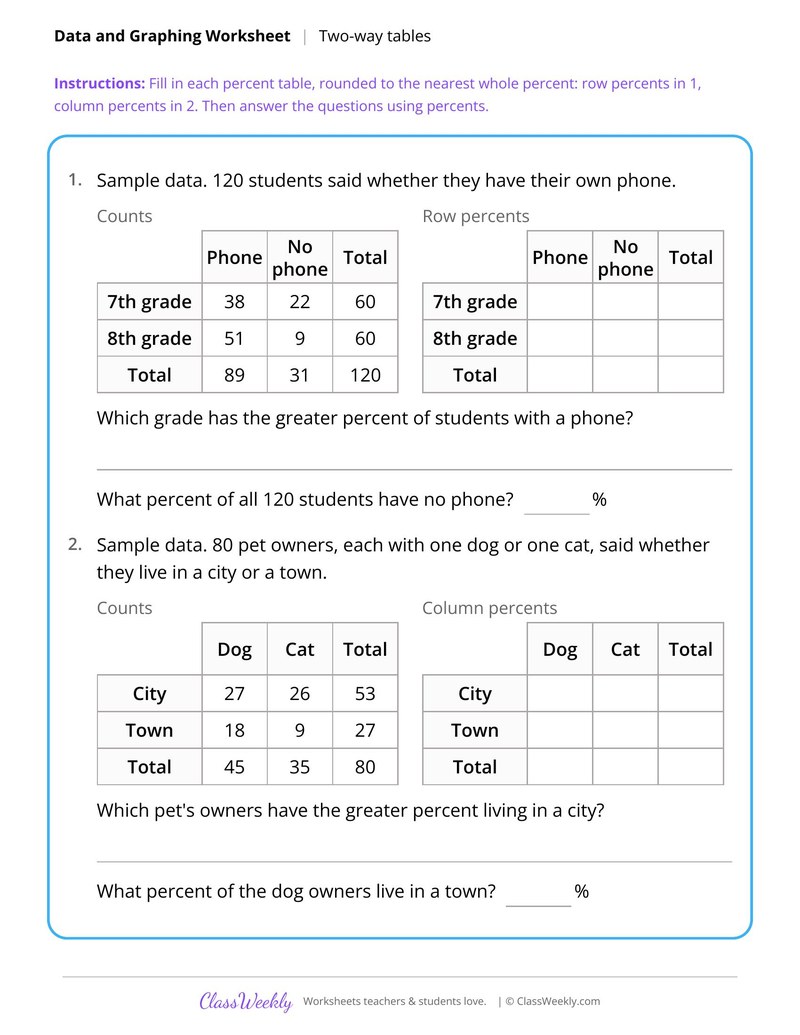
Two-Way Relative Frequency Tables by Row and Column
Curriculum Links
Common Core State Standards
Statistics and Probability · 8th Grade
Standard: Use the equation of a linear model to solve problems in the context of bivariate measurement data, interpreting the slope and intercept.
View all 8.SP.A.3 worksheets →Find this in the curriculum
Browse the grade, subject, and topic this belongs to.
FAQ
How do I use this linear models worksheet?
⌄
Use these after scatter plots and lines of best fit. Start with interpreting slope and intercept, then predictions, then writing models.
What does this worksheet teach?
⌄
Predict y from models like y = 5x + 50 and decide if each prediction makes sense near the data. The directions on the page read: Use each linear model to predict y. Circle yes if the prediction makes sense for the situation and stays near the data. Circle no if it does not. An answer key is included.
Can I use this linear models worksheet for homeschool or classroom?
⌄
Yes, both. We made it for 8th grade data & graphing, and it works the same at home or at school. At home, a student can work through it alone and then go over it with you, which shows quickly what is solid and what needs another look. In class it works as independent practice, homework or a warm-up, and you can print one copy or a full set.
What does the slope of a linear model tell you?
⌄
It tells how much y changes for each one unit increase in x, in the units of the problem. For a model of maple trees, y = 1.5x + 3, each year adds about 1.5 feet of height.
When does a prediction from a linear model not make sense?
⌄
When x is far outside the data or the answer is impossible in the situation, such as a score above 100. Use a Linear Model to Make Predictions asks students to circle yes or no for each prediction.
How do you write the equation of a line of best fit?
⌄
Pick two points on the line, find the slope from them, then solve for the y-intercept. Write a Linear Model From a Scatter Plot circles two points on each line to start.
Ratings & Reviews
No reviews yet. Be the first to share what you think.
Reviews are for ClassWeekly members.
Make a Request
Spotted something to fix, or want a worksheet we don't have yet? Tell us and we'll make it.
Worksheet Details
| Grade | 8th Grade |
| Subject | Math |
| Topic | Data & Graphing |
| Standard | 8.SP.A.3 |
| Pages | 1 page |
| Difficulty | Medium |
Learn More
What is ClassWeekly?
ClassWeekly offers free worksheets and printable learning resources for kids, from preschool up. All worksheets are aligned to Common Core, NGSS, and C3 Framework standards and designed by educators. Become a member to access the full library and download unlimited PDFs.
Describe Association in Scatter Plots
Construct Scatter Plots From Data Tables
Draw and Judge Lines of Best Fit
Plant Growth Study With Scatter Plots
Interpret Slope and Intercept of a Line of Best Fit
Write a Linear Model From a Scatter Plot
Build Two-Way Frequency Tables From Surveys
Two-Way Relative Frequency Tables by Row and Column