Make Predictions From Survey Data
Written by Adi Ackerman, Head Teacher
"Make Predictions From Survey Data" is written for 8th Grade (Ages 13-14). A 7th grader who is already steady on probability can use it too, and an older student can use it as a short review.
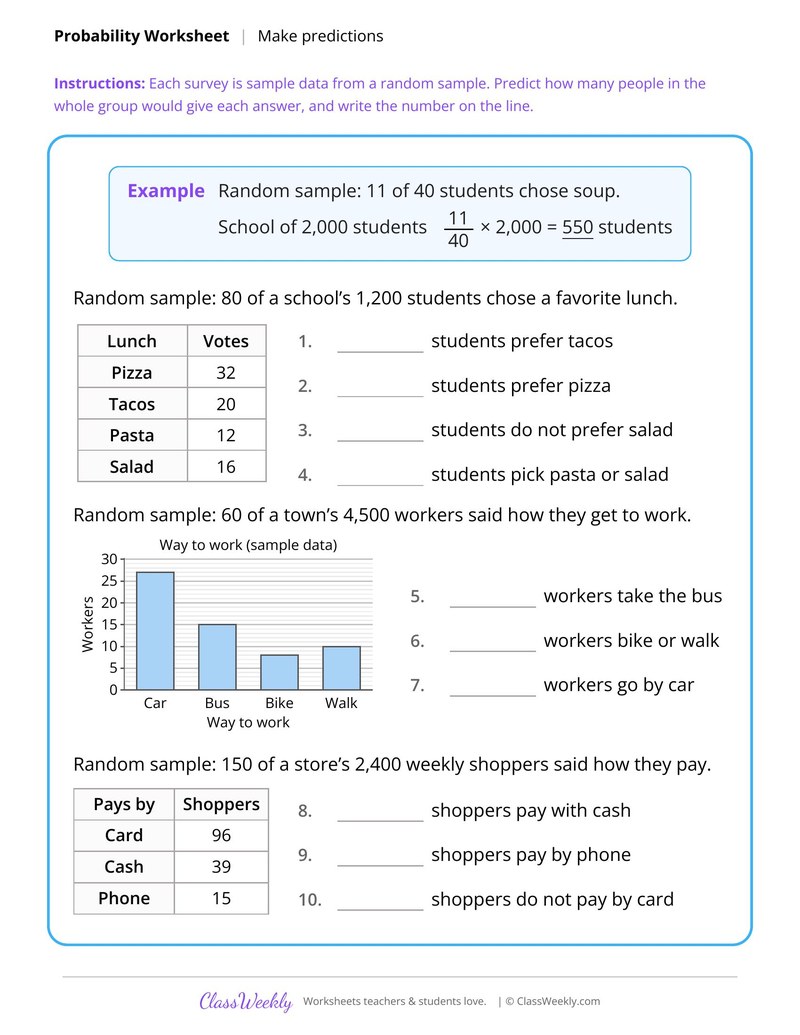
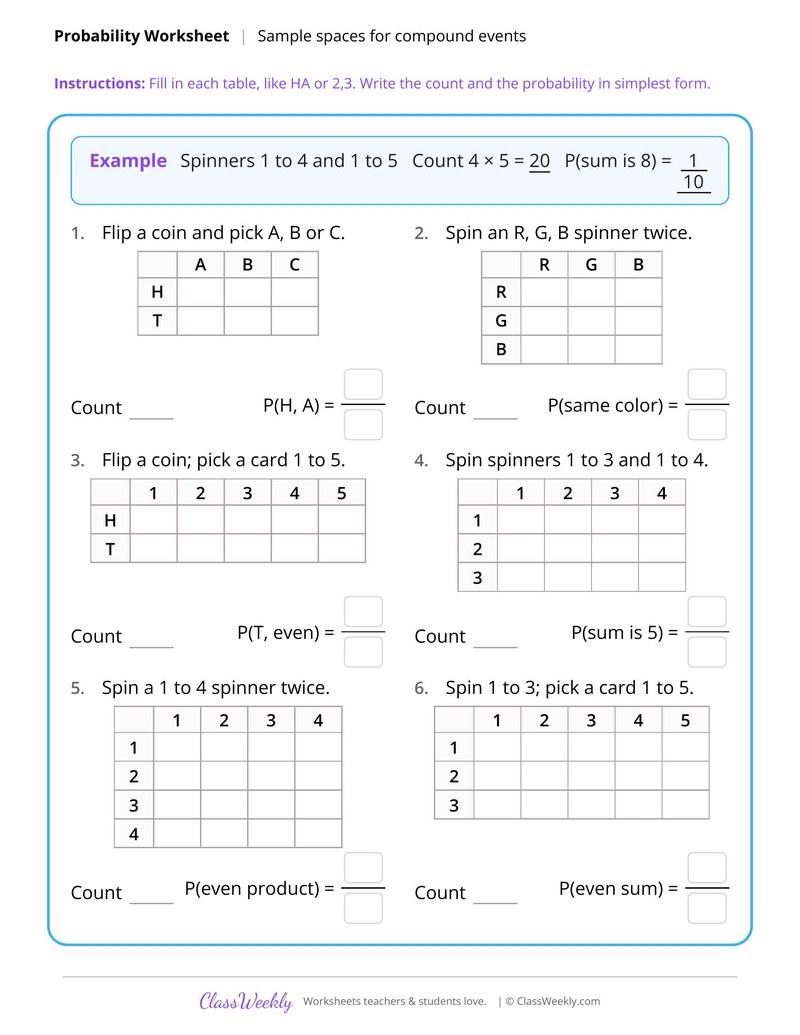
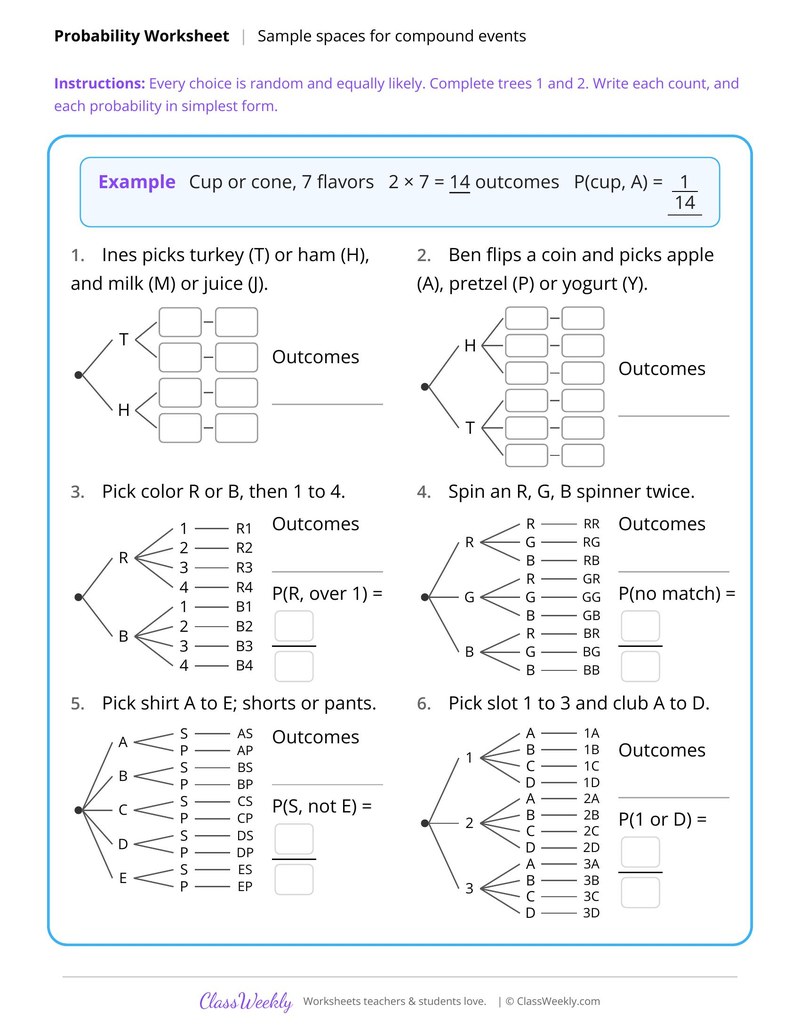
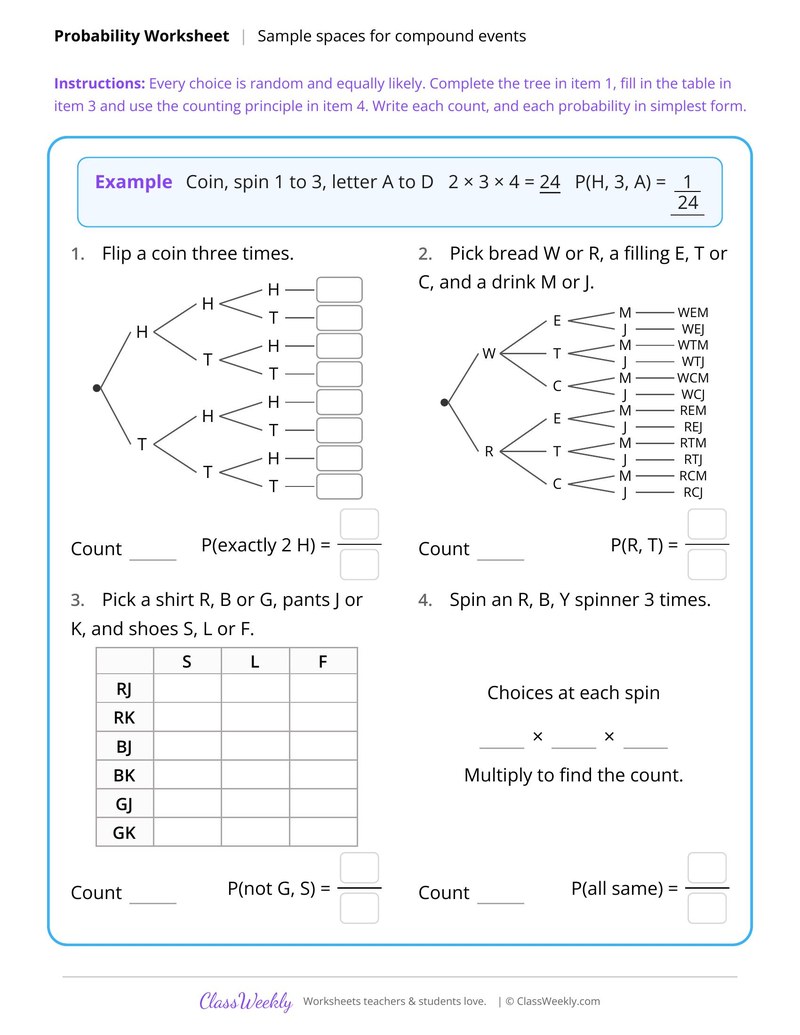
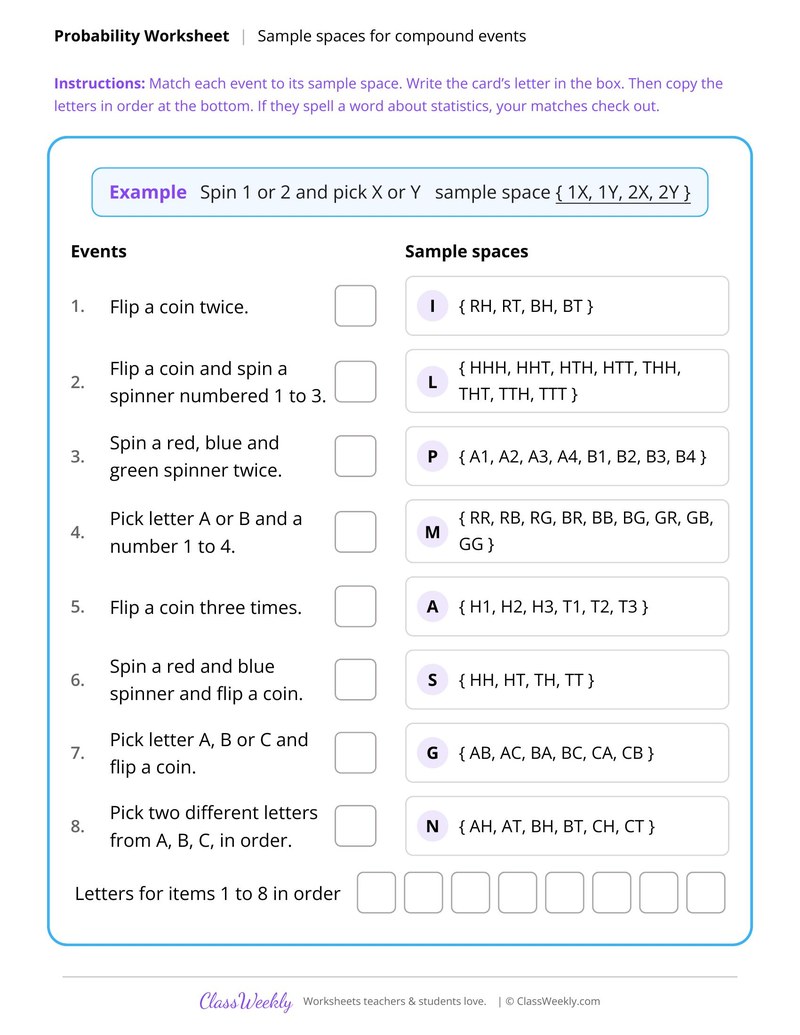
8th grade math worksheet: use random sample surveys of lunches, ways to work and payment types to predict counts for a whole group. Answer key included. Part of our experimental probability collection.
How do I use this worksheet?
Begin with Experimental Probability From Tables, then move to the comparison and experiment sheets. Finish with the prediction sheets and use Is the Prediction Reasonable as a check.
What students will practice
- Students will use a random sample to predict how many people in a whole group give an answer.
- Students will read survey results from tables and a bar graph.
- Students will predict counts for a school of 1,200, a town of 4,500 and a store of 2,400.
Curriculum Links
Find this in the curriculum
Browse the grade, subject, and topic this belongs to.
FAQ
How do I use this experimental probability worksheet?
⌄
Begin with Experimental Probability From Tables, then move to the comparison and experiment sheets. Finish with the prediction sheets and use Is the Prediction Reasonable as a check.
What does this worksheet teach?
⌄
Use random sample surveys of lunches, ways to work and payment types to predict counts for a whole group. The directions on the page read: Each survey is sample data from a random sample. Predict how many people in the whole group would give each answer, and write the number on the line. The page opens with a worked example, and an answer key is included.
Can I use this experimental probability worksheet for homeschool or classroom?
⌄
Yes, both. We made it for 8th grade probability, and it works the same at home or at school. At home, a student can work through it alone and then go over it with you, which shows quickly what is solid and what needs another look. In class it works as independent practice, homework or a warm-up, and you can print one copy or a full set.
How is experimental probability found?
⌄
Divide the number of times an event happened by the number of trials. If tails came up 7 times in 20 flips, the experimental probability of tails is 7/20.
How do you make a prediction from a probability?
⌄
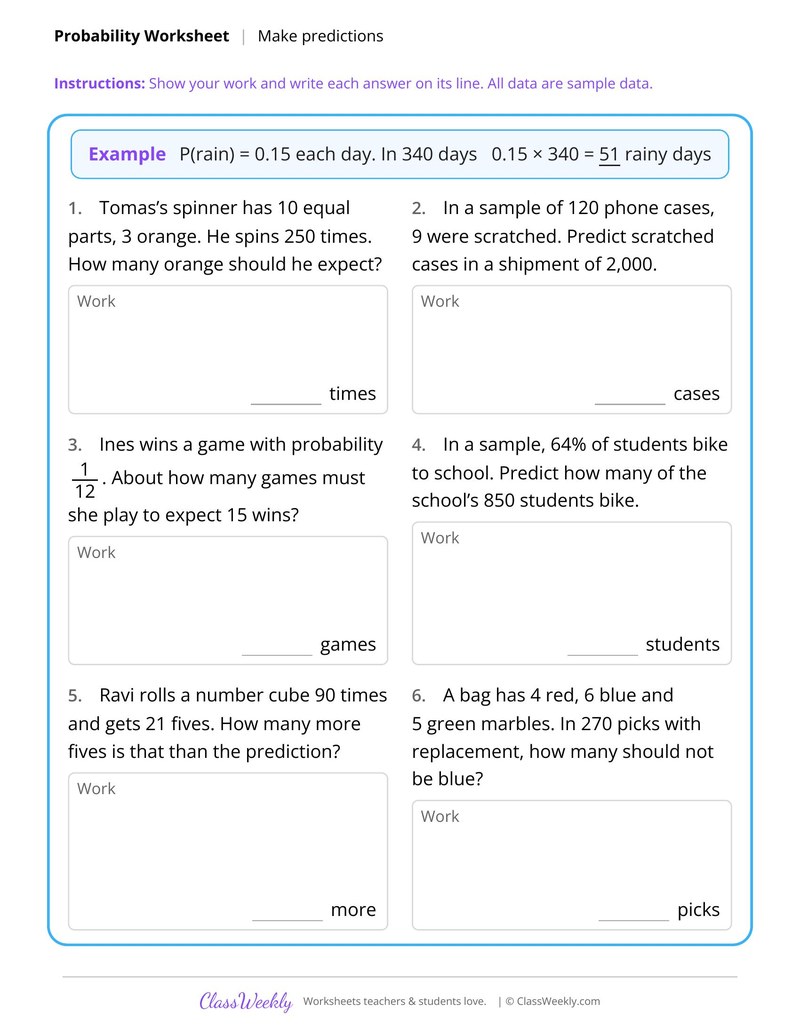
Multiply the probability by the number of trials. With P(goal) = 3/11 and 132 shots, the prediction is 36 goals.
What do students need for the experiment sheet?
⌄
Run Your Own Experiment needs a coin and a number cube. Students flip 30 times, roll 30 times and tally the results.
Are answer keys included for these sheets?
⌄
Yes. Each of the 10 experimental probability sheets comes with an answer key.
Ratings & Reviews
No reviews yet. Be the first to share what you think.
Reviews are for ClassWeekly members.
Make a Request
Spotted something to fix, or want a worksheet we don't have yet? Tell us and we'll make it.
Worksheet Details
| Grade | 8th Grade |
| Subject | Math |
| Topic | Probability |
| Pages | 1 page |
| Difficulty | Medium |
What is ClassWeekly?
ClassWeekly offers free worksheets and printable learning resources for kids, from preschool up. All worksheets are aligned to Common Core, NGSS, and C3 Framework standards and designed by educators. Become a member to access the full library and download unlimited PDFs.