Calculate Population Growth From Rates
Written by Adi Ackerman, Head Teacher
"Calculate Population Growth From Rates" is written for 7th Grade (Ages 12-13), and it covers NGSS MS-LS2-1. A 6th grader who is already steady on ecosystems can use it too, and an older student can use it as a short review.
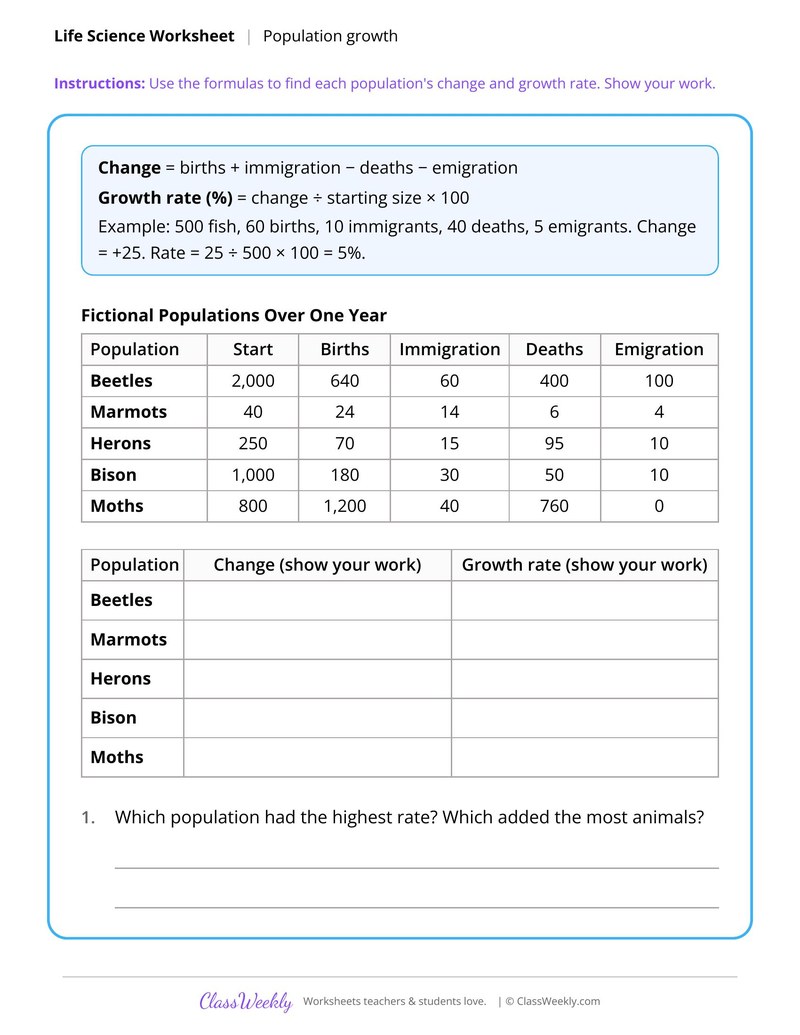
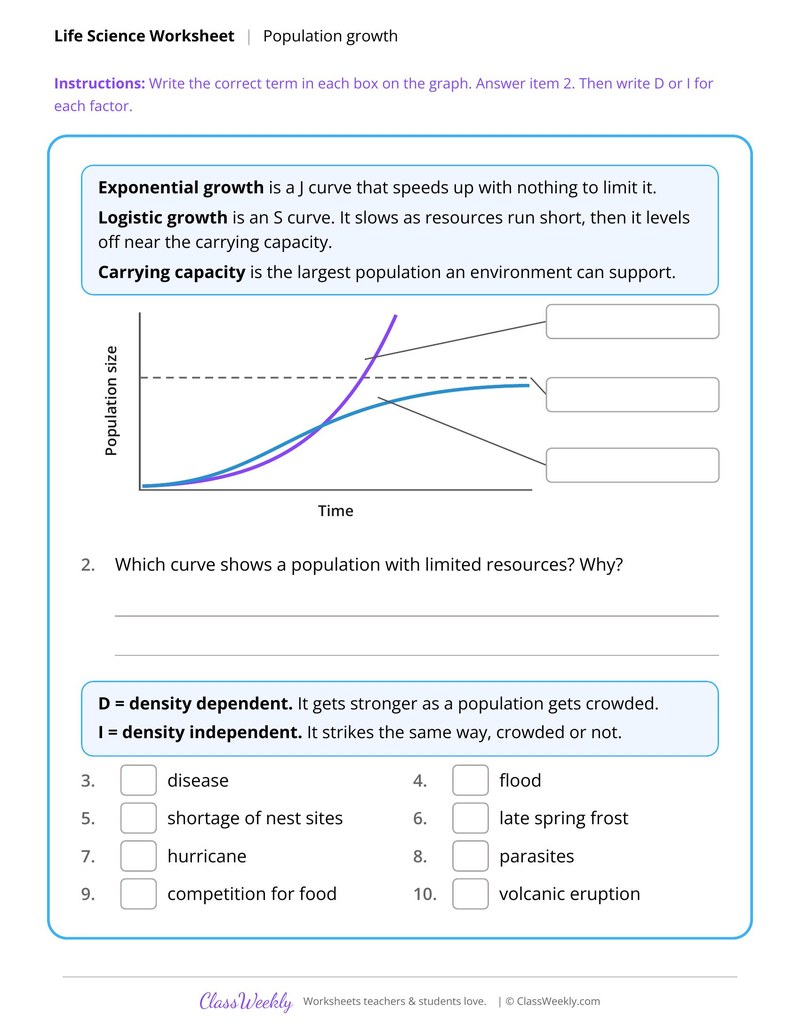
2 pages in this set
7th grade science worksheet: calculate growth rates for fictional beetles, marmots and herons, then label J and S curves. Answer key included. Part of our populations and invasive species ecosystems collection. Aligned to NGSS standards.
How do I use this worksheet?
Start with the growth rate calculations, then use the vernal pool sheet for data analysis and the cane toad organizer for reading and summarizing.
What students will practice
- Students will find population change from births, immigration, deaths and emigration.
- Students will calculate a growth rate as a percent of the starting size.
- Students will tell exponential growth from logistic growth and define carrying capacity.
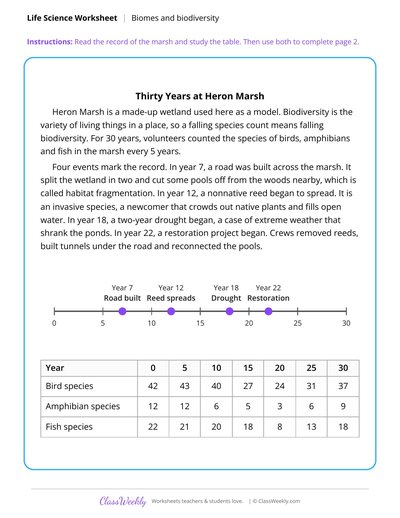
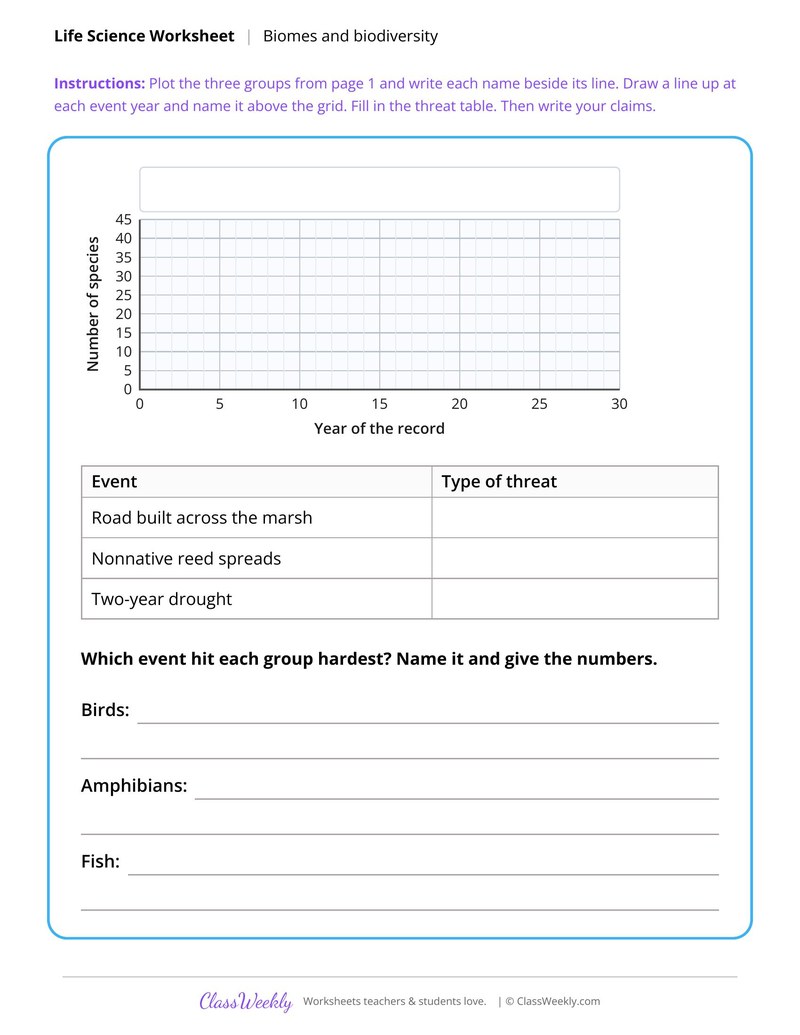
Trace Threats to a Wetland's Biodiversity
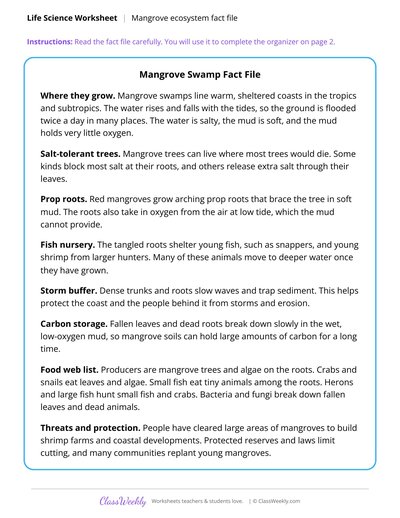
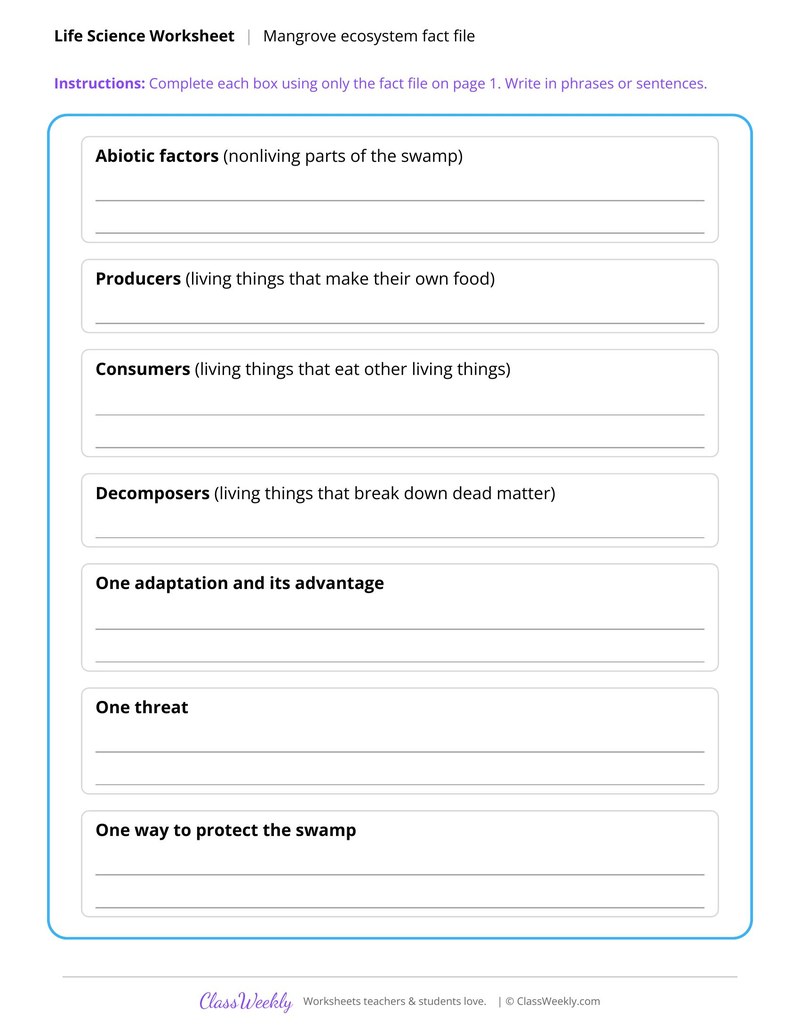
Mangrove Ecosystem Fact File Organizer
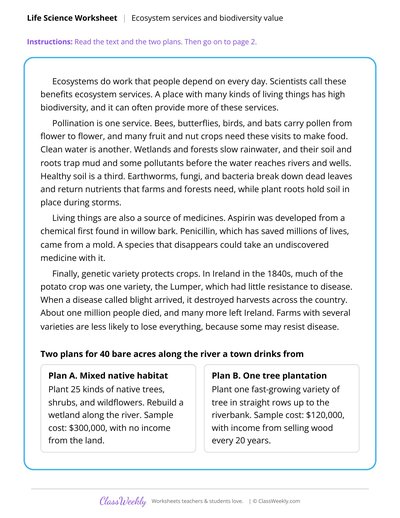
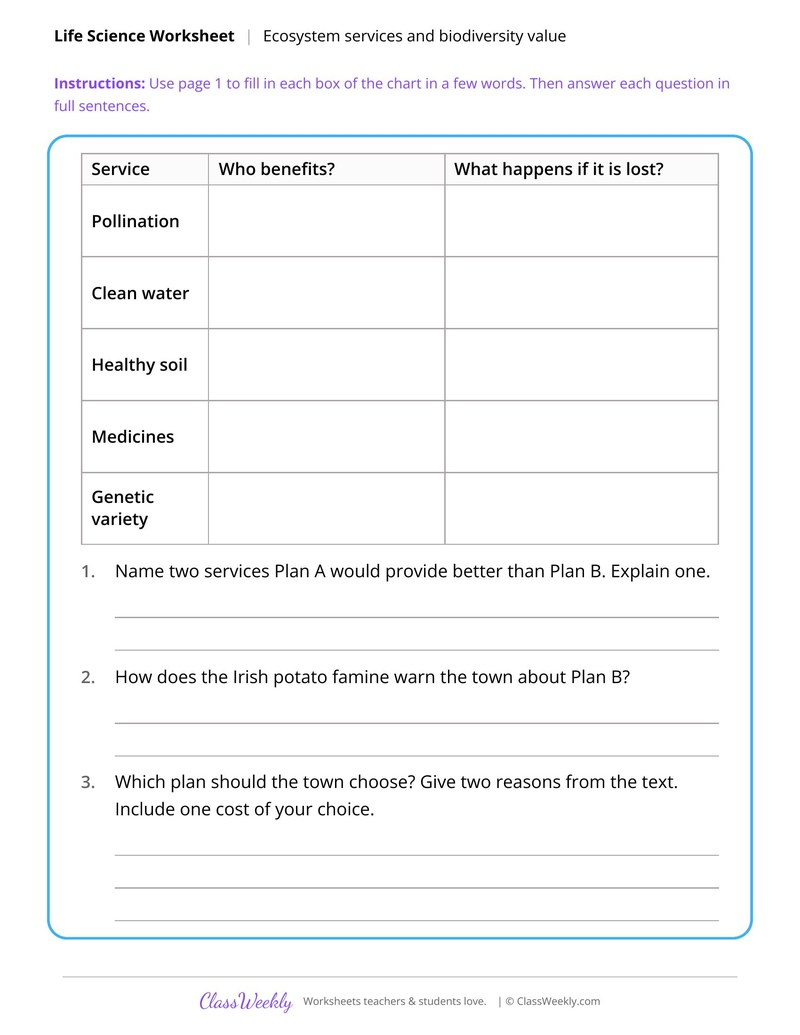
Ecosystem Services and Biodiversity Value
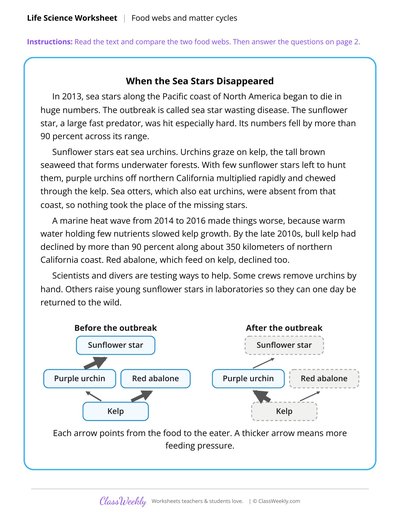
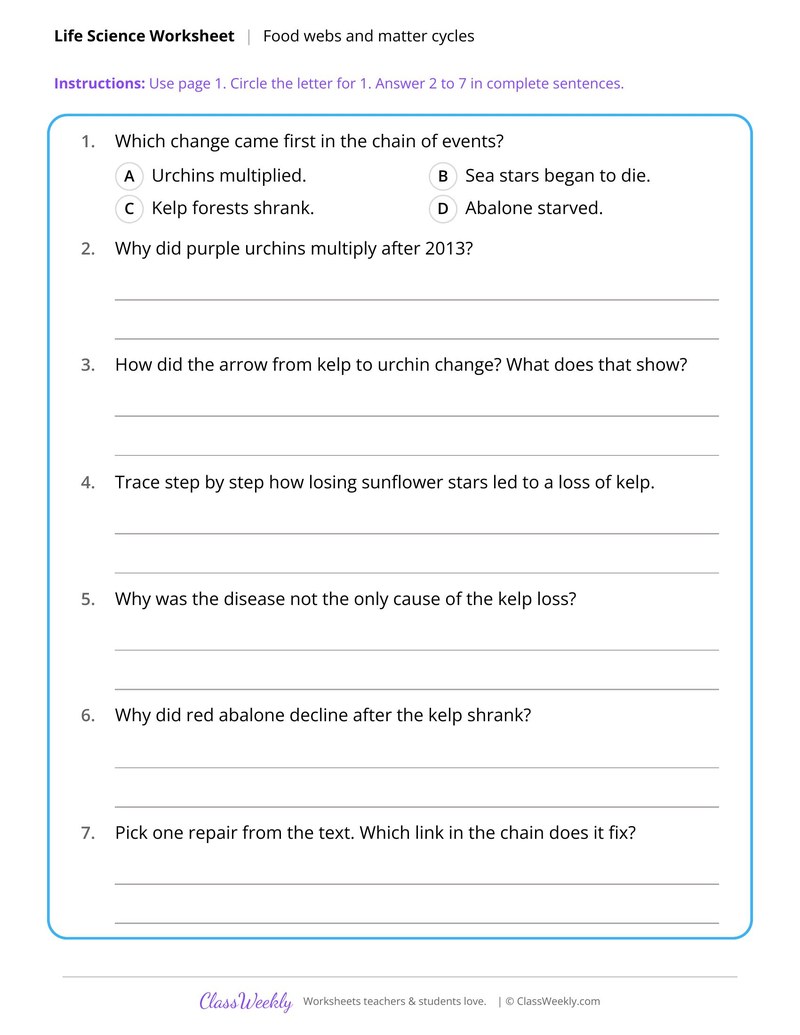
Sea Star Loss and the Kelp Forest Chain
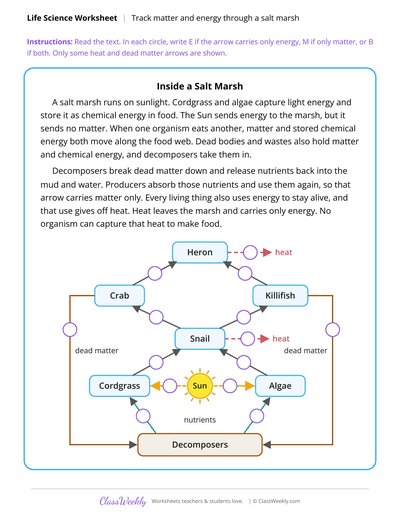
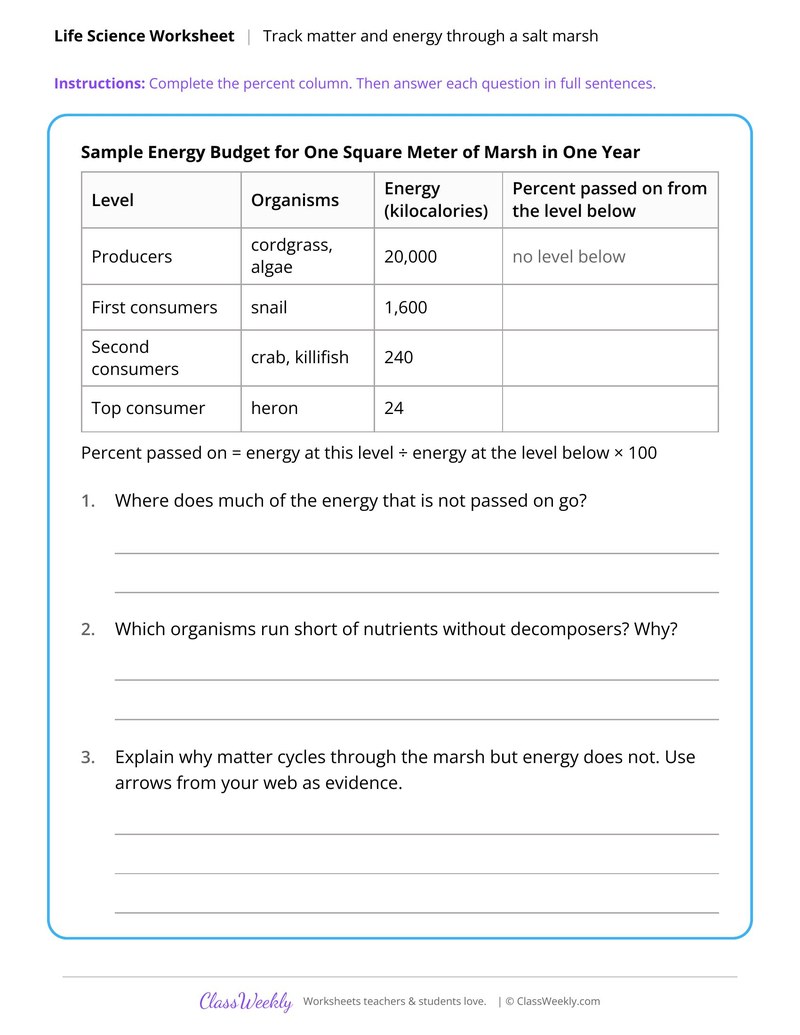
Track Matter and Energy Through a Salt Marsh
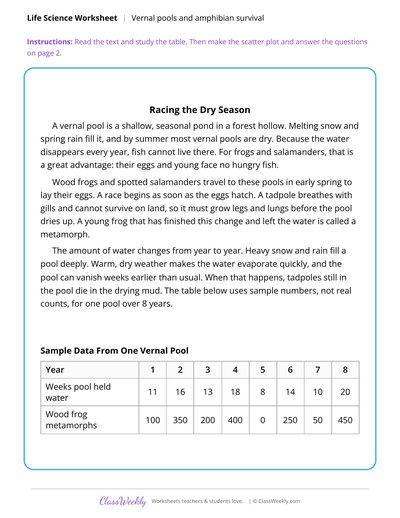
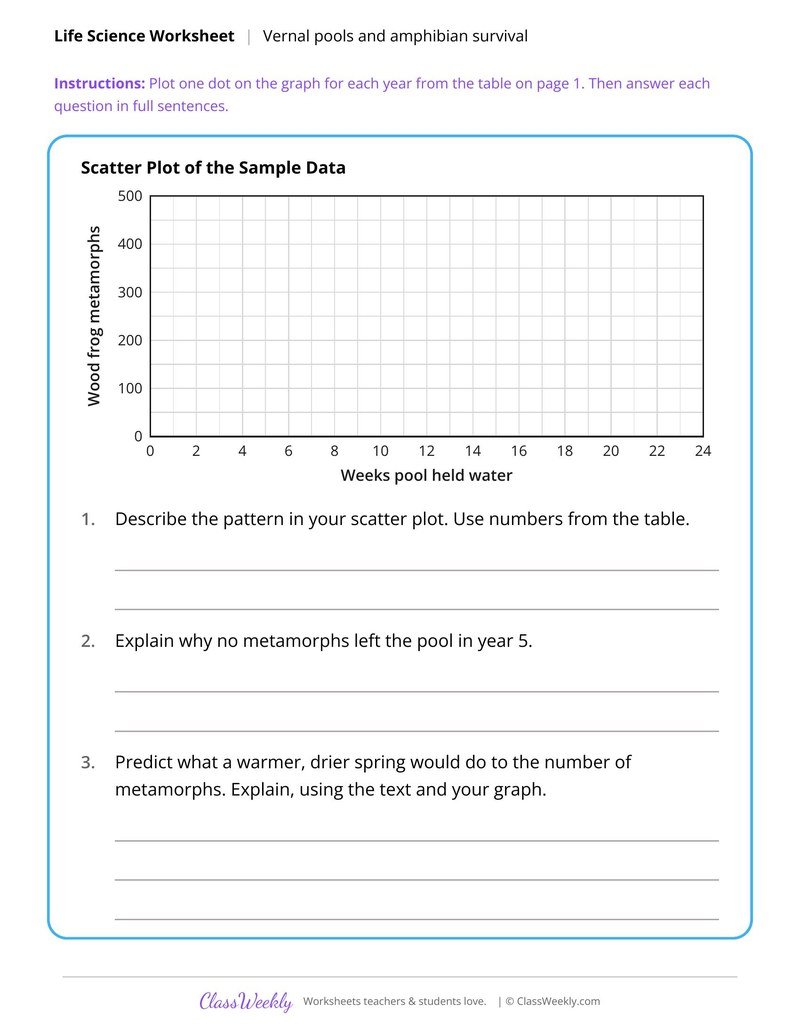
Vernal Pools and Amphibian Survival
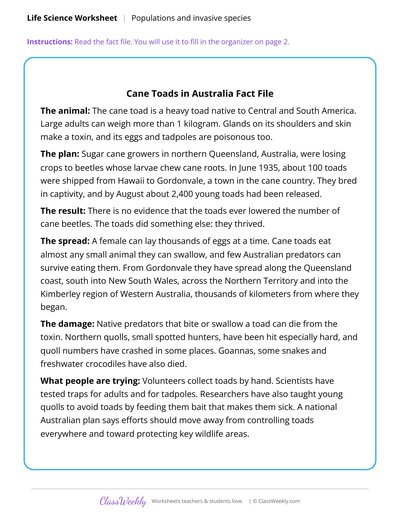
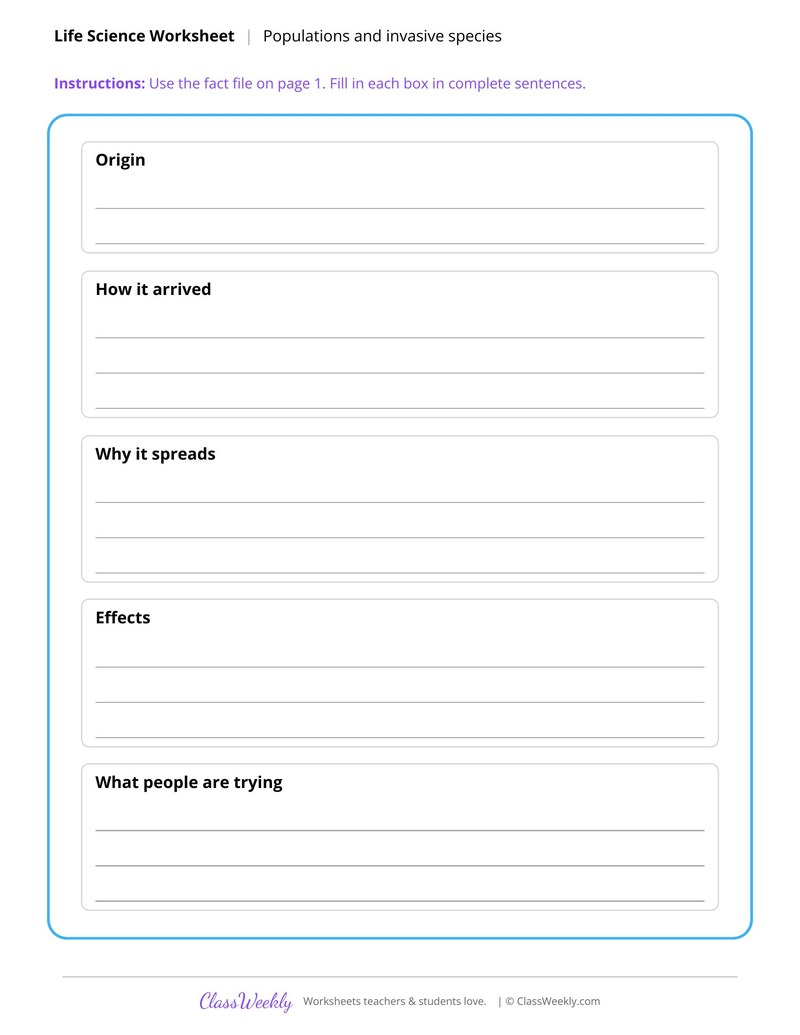
Invasive Species Fact File Organizer
Analyze Organism Interactions From Population Graphs
Curriculum Links
Next Generation Science Standards
Science · 7th Grade
Find this in the curriculum
Browse the grade, subject, and topic this belongs to.
FAQ
How do I use this populations and invasive species worksheet?
⌄
Start with the growth rate calculations, then use the vernal pool sheet for data analysis and the cane toad organizer for reading and summarizing.
What does this worksheet teach?
⌄
Calculate growth rates for fictional beetles, marmots and herons, then label J and S curves. The directions on the page read: Use the formulas to find each population's change and growth rate. Show your work. An answer key is included.
Can I use this populations and invasive species worksheet for homeschool or classroom?
⌄
Yes, both. We made it for 7th grade ecosystems, and it works the same at home or at school. At home, a student can work through it alone and then go over it with you, which shows quickly what is solid and what needs another look. In class it works as independent practice, homework or a warm-up, and you can print one copy or a full set.
What is carrying capacity?
⌄
It is the largest population an environment can support. Logistic growth is an S curve that levels off near it.
What is exponential growth?
⌄
It is a J curve that speeds up with nothing to limit it.
Why did cane toads spread in Australia?
⌄
About 100 toads were shipped to Queensland in June 1935 to fight beetles in sugar cane. They bred and spread, and the organizer asks students to record why.
Ratings & Reviews
No reviews yet. Be the first to share what you think.
Reviews are for ClassWeekly members.
Make a Request
Spotted something to fix, or want a worksheet we don't have yet? Tell us and we'll make it.
Worksheet Details
| Grade | 7th Grade |
| Subject | Science |
| Topic | Ecosystems |
| Standard | MS-LS2-1 |
| Pages | 2 pages |
| Difficulty | Medium |
Learn More
What is ClassWeekly?
ClassWeekly offers free worksheets and printable learning resources for kids, from preschool up. All worksheets are aligned to Common Core, NGSS, and C3 Framework standards and designed by educators. Become a member to access the full library and download unlimited PDFs.
Trace Threats to a Wetland's Biodiversity
Mangrove Ecosystem Fact File Organizer
Ecosystem Services and Biodiversity Value
Sea Star Loss and the Kelp Forest Chain
Track Matter and Energy Through a Salt Marsh
Vernal Pools and Amphibian Survival
Invasive Species Fact File Organizer
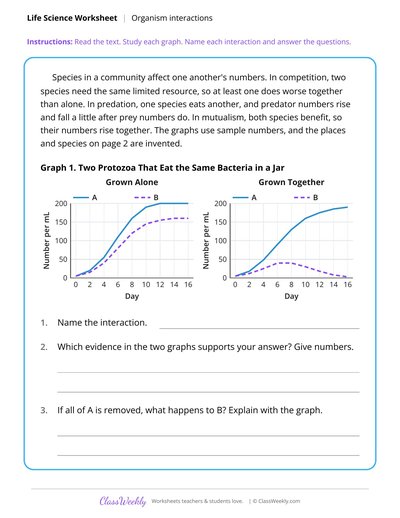
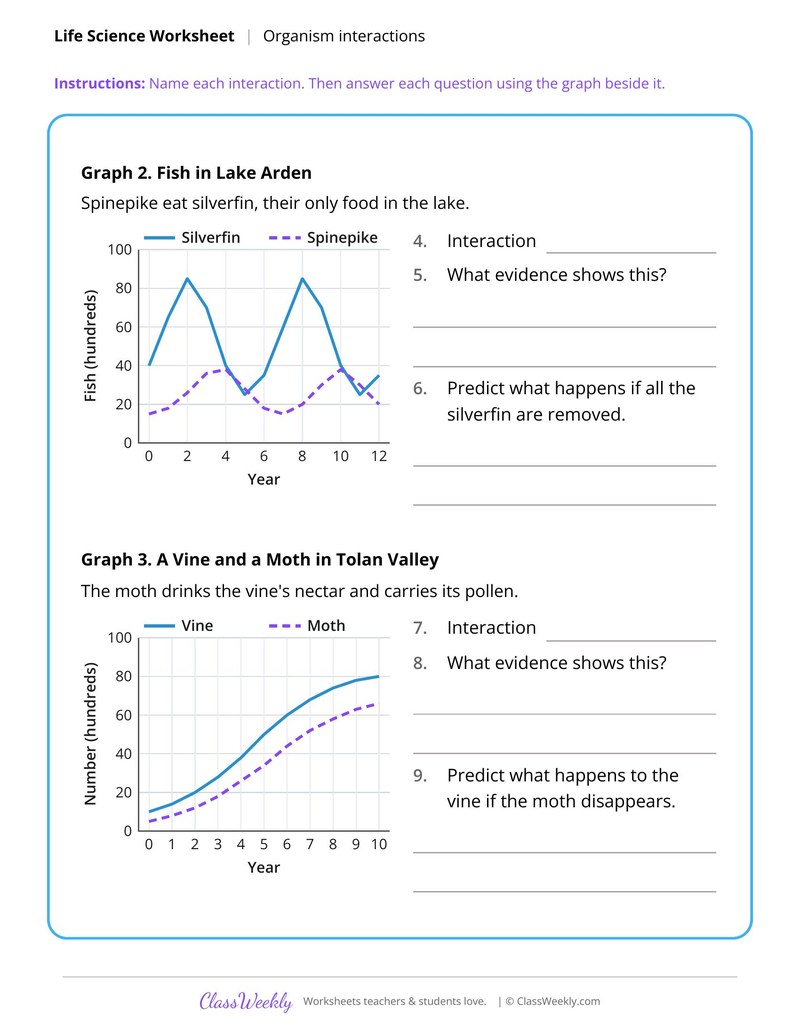
Analyze Organism Interactions From Population Graphs