Line Plot Time Spent Reading
Written by Adi Ackerman, Head Teacher
"Line Plot Time Spent Reading" is written for 5th Grade (Ages 10-11), and it covers Common Core 5.MD.B.2. If your little one is a year younger but already steady on data & graphing, the page still works. You may just need to read the instructions out loud. And if they are older and line plots with fractions never quite stuck, this is a short review rather than busywork.
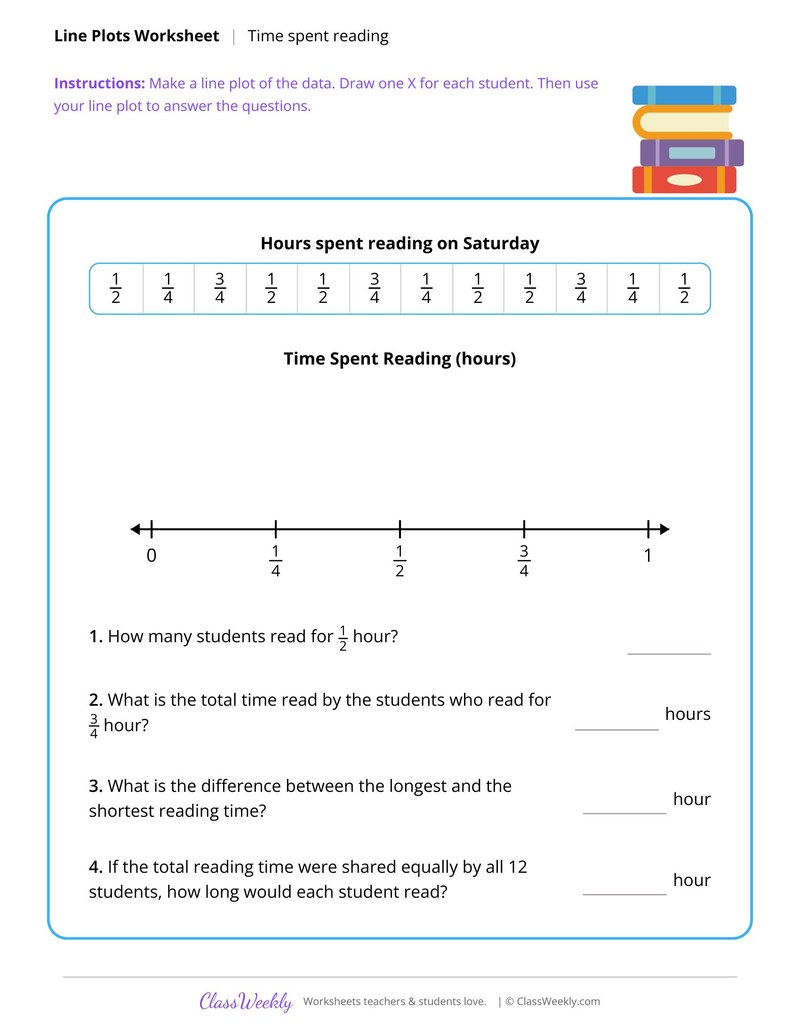
5th grade data worksheet: plot 12 students' reading times in fractions of an hour on a line plot, then answer 4 questions. Answer key included. Part of our line plots with fractions data & graphing collection. Aligned to Common Core standards.
How do I use this worksheet?
Print the page and read the directions with your child: Make a line plot of the data. Draw one X for each student. Then use your line plot to answer the questions. When they finish, check the work together with the answer key.
What students will practice
- Students will make a line plot of data in fractions of a unit.
- Students will add and subtract fractions to answer questions.
- Students will share a total equally among a group.
Curriculum Links
Common Core State Standards
Measurement and Data · 5th Grade
Standard: Make a line plot to display a data set of measurements in fractions of a unit (1/2, 1/4, 1/8). Use operations on fractions for this grade to solve problems involving information presented in line plots.
View all 5.MD.B.2 worksheets →Find this in the curriculum
Browse the grade, subject, and topic this belongs to.
FAQ
How do I use this line plots with fractions worksheet?
⌄
Print the page and read the directions with your child: Make a line plot of the data. Draw one X for each student. Then use your line plot to answer the questions. When they finish, check the work together with the answer key.
What does this worksheet teach?
⌄
Data for 12 students shows hours spent reading on Saturday in fractions of an hour: 1/4, 1/2 and 3/4. Children draw one X for each student on a line plot, then answer four questions, including the difference between the longest and shortest times and how long each student would read if the total were shared equally. The directions on the page read: Make a line plot of the data. Draw one X for each student. Then use your line plot to answer the questions. An answer key is included.
Can I use this line plots with fractions worksheet for homeschool or classroom?
⌄
Yes, both. We made it for 5th Grade data & graphing, and the page works the same whether it lands on a kitchen table or a center rotation. At home, most families go through it together and talk the answers out loud, and that talking is where most of the learning happens with line plots with fractions. In class it runs well as independent work while you pull a small group. Print one copy or thirty, whichever the day needs.
How do you find the total on a line plot?
⌄
Multiply each value by the number of X marks above it, then add the products. Three X marks at 1/4 hour make 3/4 hour.
Is there an answer key?
⌄
Yes. Both line plot sheets have an answer key.
What data and graphing skills do fifth graders develop?
⌄
Fifth-grade data and statistics focuses on representing and interpreting data in more complex graphical forms and computing basic statistical measures (CCSS 5.MD.B.2). Students create and interpret line plots that include fractional data values (a line plot showing plant heights measured to the nearest 1/8 inch), and they solve problems involving operations on the data in the plot. They also work with double bar graphs and double line graphs (comparing two data sets), stem-and-leaf plots, and circle graphs. Measures of center (mean, median, mode) and spread (range) are introduced or deepened at this level. A key data skill is choosing the right graph type for a given data set: bar graphs for categories, line graphs for change over time, stem-and-leaf plots for examining distribution. Worksheets that include both graph construction and interpretation (reading a graph to answer questions) develop the full competency. Interpretation tasks should include questions that require going beyond reading individual data points to drawing comparisons or making inferences.
How do fifth graders read and create double bar graphs?
⌄
A double bar graph shows two data sets side by side for the same categories, using bars of different colors or patterns to distinguish them. Reading a double bar graph requires using the legend, identifying which bar corresponds to which data set, and reading bar heights precisely to the nearest labeled unit or interpolating between gridlines. Creating a double bar graph requires choosing a consistent scale, drawing bars of uniform width, spacing pairs of bars evenly, and including a complete legend. Common errors include using different scales for the two data sets (making one appear much larger), unlabeled axes, and a missing legend that makes the two data sets indistinguishable. Worksheets that give students partially completed double bar graphs (one data set drawn, one to complete) reduce setup time while still building the skills needed for full construction. Interpretation questions that compare the two data sets (which month showed the largest difference between sales? in which category were the values most similar?) develop analytical reading skills beyond simple data retrieval.
What is a stem-and-leaf plot and when do fifth graders learn it?
⌄
A stem-and-leaf plot organizes numerical data by splitting each value into a stem (the leading digits) and a leaf (the trailing digit). For data in the range 40-80, the tens digits become stems (4, 5, 6, 7, 8) and the ones digits become leaves. The plot shows all individual data values while revealing the overall distribution shape, making it useful for identifying clusters, gaps, and outliers. Fifth graders create stem-and-leaf plots from raw data sets and answer questions about them, including identifying the median (the middle value once the leaves are ordered), mode (the most common leaf for a given stem), and range. A back-to-back stem-and-leaf plot shows two data sets using the same stems, with leaves branching in opposite directions; this format is useful for comparing two groups (boys vs. girls, before vs. after). Worksheets should require students to order the leaves in ascending order within each stem, since an unordered stem-and-leaf plot is a common construction error that makes finding median and mode unreliable.
Ratings & Reviews
No reviews yet. Be the first to share what you think.
Reviews are for ClassWeekly members.
Make a Request
Spotted something to fix, or want a worksheet we don't have yet? Tell us and we'll make it.
Worksheet Details
| Grade | 5th Grade |
| Subject | Math |
| Topic | Data & Graphing |
| Standard | 5.MD.B.2 |
| Pages | 1 page |
| Difficulty | Medium |
Learn More
What is ClassWeekly?
ClassWeekly offers free worksheets and printable learning resources for kids, from preschool up. All worksheets are aligned to Common Core, NGSS, and C3 Framework standards and designed by educators. Become a member to access the full library and download unlimited PDFs.