One Data Set Three Ways
Written by Adi Ackerman, Head Teacher
"One Data Set Three Ways" is written for 1st Grade (Ages 6-7), and it covers Common Core 1.MD.C.4. If your little one is a year younger but already steady on data & graphing, the page still works. You may just need to read the instructions out loud. And if they are older and tally charts and bar graphs never quite stuck, this is a short review rather than busywork.
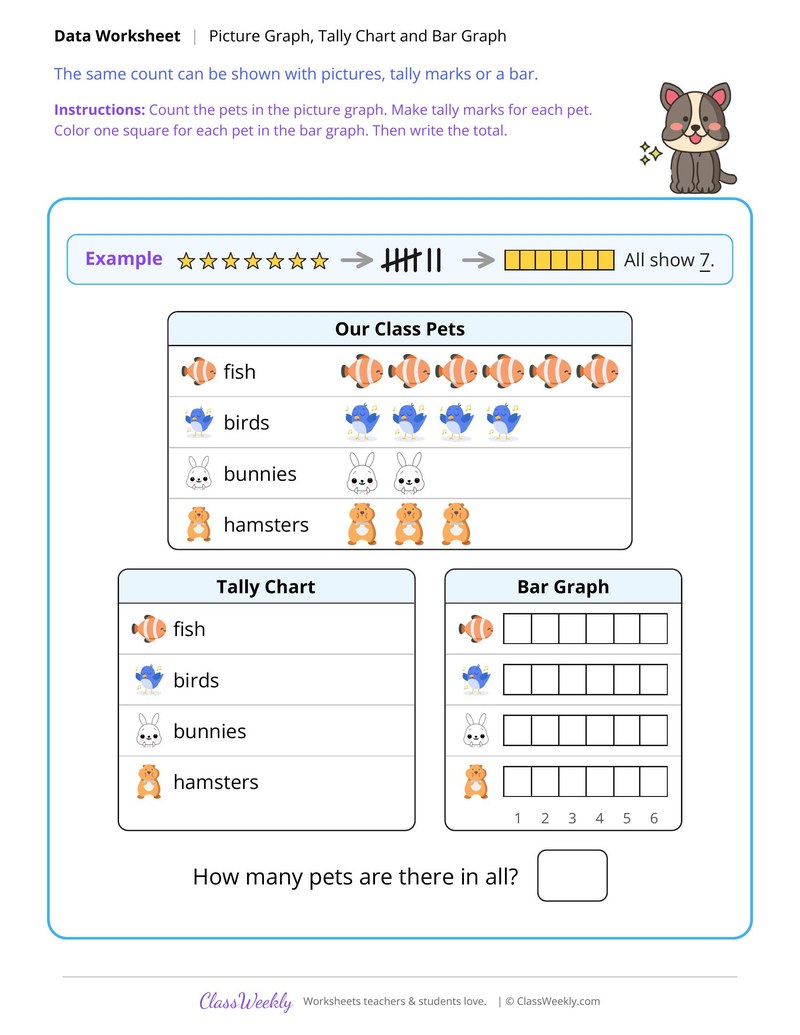
1st grade math worksheet: count class pets like fish and bunnies in a picture graph, make tally marks and color a bar graph. Answer key included. Part of our tally charts and bar graphs data & graphing collection. Aligned to Common Core standards.
How do I use this worksheet?
Make a quick tally of toys at home, then color a bar for each one together. Ask your child which graph is easier to read and why.
What students will practice
- Students will count fish, birds, bunnies and hamsters in a picture graph.
- Students will make tally marks and color a bar graph for the same pets.
- Students will write the total number of pets.
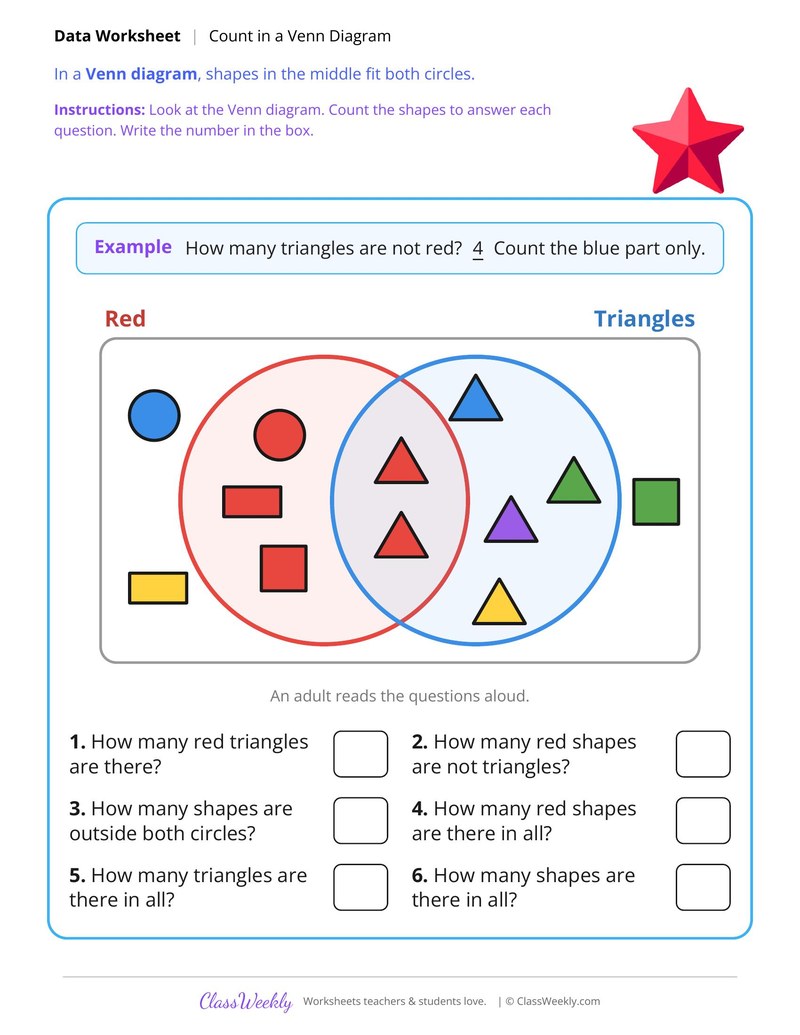
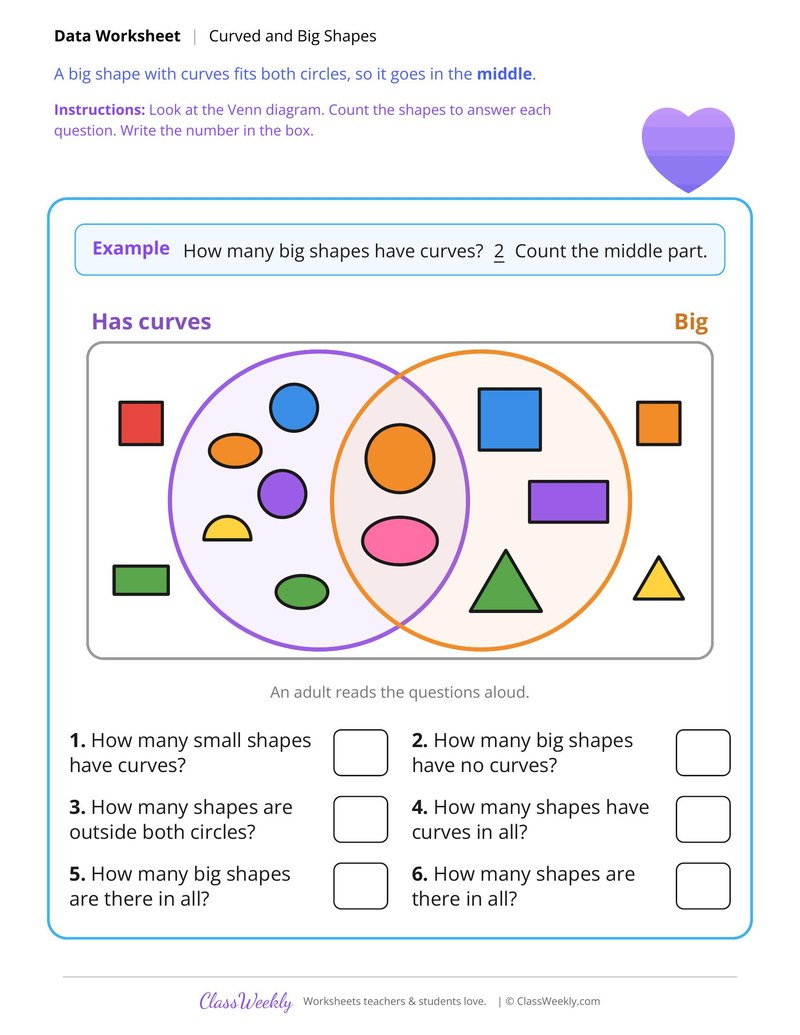
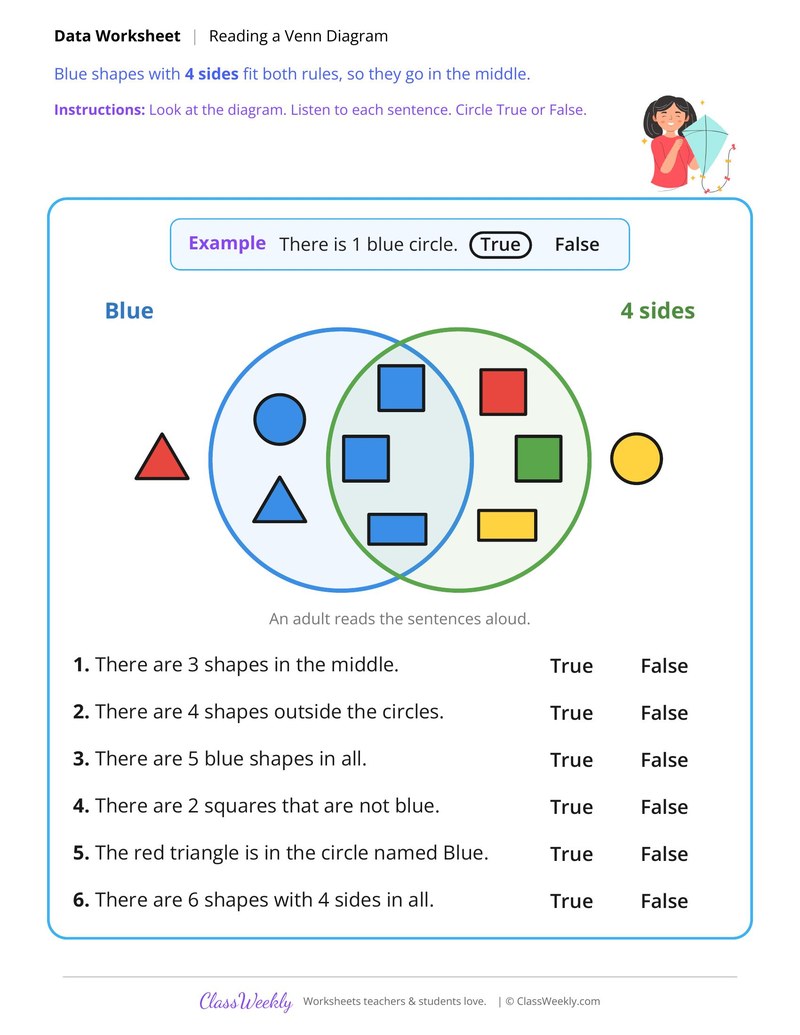


Curriculum Links
Common Core State Standards
Measurement and Data · 1st Grade
Standard: Organize, represent, and interpret data with up to three categories; ask and answer questions about the total number of data points, how many in each category, and how many more or less are in one category than in another.
View all 1.MD.C.4 worksheets →Find this in the curriculum
Browse the grade, subject, and topic this belongs to.
FAQ
How do I use this tally charts and bar graphs worksheet?
⌄
Make a quick tally of toys at home, then color a bar for each one together. Ask your child which graph is easier to read and why.
What does this worksheet teach?
⌄
Count class pets like fish and bunnies in a picture graph, make tally marks and color a bar graph. The directions on the page read: Count the pets in the picture graph. Make tally marks for each pet. Color one square for each pet in the bar graph. Then write the total. The page opens with a worked example, and an answer key is included.
Can I use this tally charts and bar graphs worksheet for homeschool or classroom?
⌄
Yes, both. We made it for 1st Grade data & graphing, and the page works the same whether it lands on a kitchen table or a center rotation. At home, most families go through it together and talk the answers out loud, and that talking is where most of the learning happens with tally charts and bar graphs. In class it runs well as independent work while you pull a small group. Print one copy or thirty, whichever the day needs.
How are tally charts and bar graphs alike?
⌄
Both show how many are in each group. A tally chart uses marks, and a bar graph uses bars that reach a number.
What does One Data Set Three Ways ask?
⌄
Children count fish, birds, bunnies and hamsters in a picture graph. Then they make tally marks, color a bar graph and write the total.
Which standard do these sheets support?
⌄
They support 1.MD.C.4, organizing, showing and reading data with up to three groups.
Ratings & Reviews
No reviews yet. Be the first to share what you think.
Reviews are for ClassWeekly members.
Make a Request
Spotted something to fix, or want a worksheet we don't have yet? Tell us and we'll make it.
Worksheet Details
| Grade | 1st Grade |
| Subject | Math |
| Topic | Data & Graphing |
| Standard | 1.MD.C.4 |
| Pages | 1 page |
| Difficulty | Medium |
Learn More
What is ClassWeekly?
ClassWeekly offers free worksheets and printable learning resources for kids, from preschool up. All worksheets are aligned to Common Core, NGSS, and C3 Framework standards and designed by educators. Become a member to access the full library and download unlimited PDFs.